Welcome to Tuesday Truths, where I look at how well 120 teams in the nation’s top 10 conferences are doing against their league opponents on a per-possession basis.
A theory of Duke
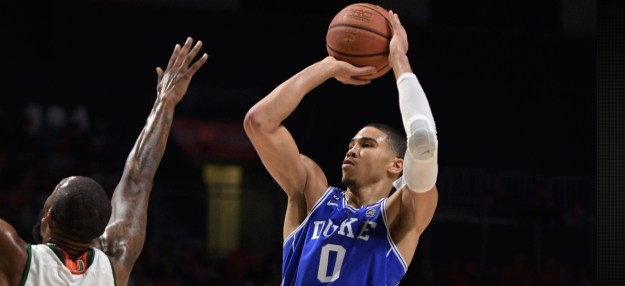
One of the better looks Jayson Tatum and the Blue Devils got against Miami. (Lance King)
Through games of February 27, conference games only
Pace: possessions per 40 minutes
PPP: points per possession Opp. PPP: opponent PPP
EM: efficiency margin (PPP – Opp. PPP)
ACC                       W-L   Pace    PPP   Opp. PPP    EM
1.  Louisville           11-5   67.9    1.13    0.99    +0.14
2.  North Carolina       13-4   70.1    1.15    1.02    +0.13
3.  Florida State        11-5   71.8    1.13    1.03    +0.10
4.  Virginia             10-7   60.7    1.04    0.96    +0.08
5.  Duke                 10-6   68.5    1.14    1.08    +0.06
6.  Notre Dame           11-5   68.0    1.10    1.06    +0.04
7.  Miami                10-7   63.7    1.06    1.04    +0.02
8.  Wake Forest           7-9   71.9    1.12    1.11    +0.01
9.  Syracuse              9-8   66.8    1.11    1.12    -0.01
10. Virginia Tech        10-7   67.6    1.10    1.13    -0.03
11. Georgia Tech          7-9   69.1    0.95    0.99    -0.04
12. Clemson              4-12   66.8    1.07    1.15    -0.08
13. Pitt                 4-12   65.1    1.06    1.15    -0.09
14. Boston College       2-14   72.0    1.01    1.15    -0.14
15. NC State             4-13   71.2    1.02    1.18    -0.16

AVG.                            68.1    1.08
Acceleration since 2015:        7.8%
KenPom rank: 2
% of games played: 91
For all we know Duke could yet win the 2017 national championship — way stranger things have happened — but invoking those trusty Stranger Things is surely not a good sign. Besides, everyone and I do mean (almost) everyone thought the Blue Devils would look much better by now than they do in the numbers shown above. What has happened so far? Continue reading