
Welcome to Tuesday Truths, where I look at how well 120 teams in the nation’s top 10 conferences are doing against their league opponents on a per-possession basis.
Duke’s season collapsed in two ways, gradually and then suddenly
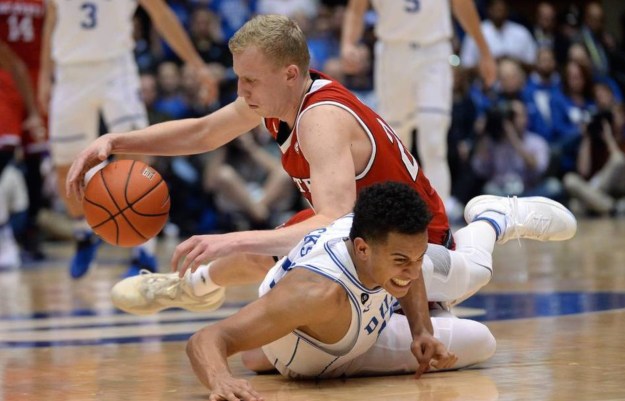
We were expressly told Duke would be good this year. What happened? (Chuck Liddy, newsobserver.com)
Through games of January 23, conference games only
Pace: possessions per 40 minutes
PPP: points per possession Opp. PPP: opponent PPP
EM: efficiency margin (PPP – Opp. PPP)
ACC                       W-L   Pace    PPP   Opp. PPP    EM
1.  North Carolina        6-1   76.4    1.14    0.99    +0.15
2.  Virginia              5-2   62.0    1.10    0.99    +0.11
3.  Louisville            4-3   68.7    1.06    0.98    +0.08
4.  Florida State         6-1   74.2    1.09    1.01    +0.08
5.  Notre Dame            6-1   67.4    1.12    1.04    +0.08
6.  Duke                  3-4   73.2    1.11    1.05    +0.06
7.  Miami                 2-4   65.7    1.03    1.05    -0.02
8.  Wake Forest           3-4   72.4    1.10    1.12    -0.02
9.  Syracuse              3-4   66.2    1.10    1.13    -0.03
10. Virginia Tech         4-3   72.2    1.07    1.11    -0.04
11. Pitt                  1-5   66.3    1.04    1.13    -0.09
12. Boston College        2-5   71.6    1.01    1.11    -0.10
13. NC State              3-5   75.2    1.02    1.12    -0.10
14. Georgia Tech          3-4   67.9    0.95    1.05    -0.10
15. Clemson               1-6   67.6    1.05    1.16    -0.11

AVG.                            69.8    1.06
Acceleration since 2015:       10.4%
KenPom rank: 2
% of games played: 39
As I watched Duke fumble away a home game and lose 84-82 to an NC State team that entered the evening 2-5 in ACC play, it occurred to me that these Blue Devils possess little or no quintessential Duke-ness. We’ve become so preoccupied with the idea of Grayson Allen as a stock Duke-villain figure that we didn’t even notice the basketball happenings.
Right, the basketball happenings. With the obvious exception of Luke Kennard and the possible ones of Frank Jackson and Matt Jones, I’m not sure any Duke player has met the expectations we had for him in October.
Allen has become “Grayson Allen,” a walking ball of drama amplification and coiled angst to the point where basketball’s wholly secondary — to his observers-slash-critics, certainly, but, possibly, to Allen himself. (Maybe he’s on to something. It’s a game.) Against the Wolfpack he went 1-of-9 on his threes until, by the tense closing moments of a game where his team had collapsed, Allen had long since let the featured-scorer baton be wrested away from him by Jayson Tatum.
On paper Tatum had a conventionally good game against NC State (16 points, nine boards), but few players better illustrate the on-again off-again NBA-Division I performance synapse than the freshman from St. Louis. Not every freshman who’s also an NBA prospect makes an impact equivalent to his potential during his one college season. Mike Krzyzewski has of course found plenty of freshmen in the past who are exceptionally productive for one year in college and then jump to the next level: Jabari, Brandon Ingram, and the national-title trio of Okafor, Winslow, and Jones.
Might Tatum, on the other hand, fall into the “high draft pick, so-so college impact” side of this synapse? His season stats are fine, but his game-ending turnover felt a little too unsurprising. He’s a freshman who shoots long fadeaway twos lovingly, with little apparent understanding that, if he’s as good as we thought, he can get a better look.
Amile Jefferson may still be injured. Harry Giles has scored 49 points this season.
Duke’s 15-5, it’s still January, and anything can happen in the postseason. But right now this team looks so lost and unimposing that even people who say they hate Duke must be having a hard time working up the effort. No road crowds will storm the floor after beating this rotating cast of five disparate and passive free-agents. It would be superfluous.
—
This Big 12 team thrives on forcing turnovers, but it’s not who you think
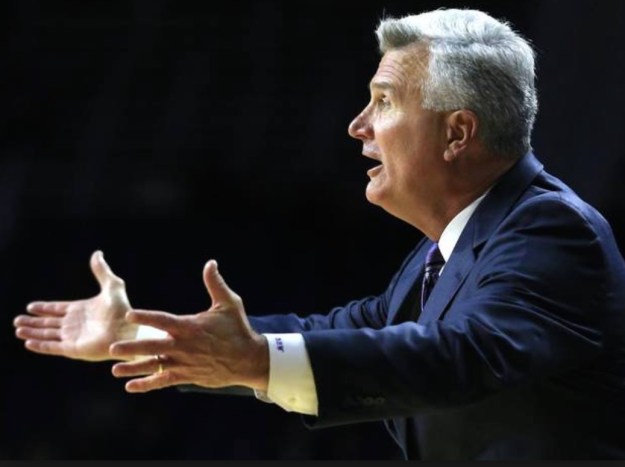
His defense would seem more fearsome if he lost the tie. (kcstar.com)
Big 12                    W-L   Pace    PPP   Opp. PPP    EM
1.  Kansas                7-0   72.3    1.15    1.04    +0.11
2.  West Virginia         4-3   71.2    1.11    1.03    +0.08
3.  Baylor                6-1   66.1    1.04    0.96    +0.08
4.  Iowa State            4-3   68.9    1.09    1.05    +0.04
5.  Kansas State          4-3   69.0    1.11    1.08    +0.03
6.  Oklahoma State        2-6   70.8    1.12    1.15    -0.03
7.  TCU                   3-5   68.8    1.01    1.07    -0.06
8.  Texas                 2-6   72.7    0.97    1.03    -0.06
9.  Oklahoma              2-6   71.4    0.98    1.05    -0.07
10. Texas Tech            3-4   64.7    1.04    1.14    -0.10

AVG.                            69.6    1.06
Acceleration since 2015:        7.4%
KenPom rank: 1
% of games played: 41
As of this past weekend, the Big 12 has a new leader in the highly competitive field of forcing opponents into turnovers.
Opponent turnover percentage
Conference games only
                      Opp. TO%
1. Kansas State         24.6
2. West Virginia        24.4
3. Iowa State           24.2
Ironically it was none other than the West Virginia offense that pushed Kansas State to No. 1 in this category. The Mountaineers visited Manhattan on Saturday and gave the ball away 23 times in 75 possessions.
True, the ultimate test of any defense that forces turnovers is how well it does the other 75 percent of the time. K-State has allowed its Big 12 opponents to score 1.43 points per “effective” (turnover-less) possession, a high number that marks the Wildcat defense as having distinct feast-or-famine tendencies. For its part Press Virginia is allowing conference opponents to score 1.36 points on each effective trip — better than Iowa State’s number (1.39), but still not in the same zip code as the showy “we don’t need your turnovers” Baylor defense (1.16).
Defense isn’t the lone or final barometer of any of these three teams, of course. Quite the opposite, the Wildcats, Mountaineers and Cyclones all have excellent offenses. (No one has shot better from the field in Big 12 play than KSU — perhaps they’d be perceived accordingly if not for Svi Mykhailiuk’s self-guided walking tour of AFH.) But it’s fair to say an opponent that takes care of the ball can present a problem to all three of these defenses.
“How ya’ like me now, Rex Pflueger!” In calendar year 2017 Monte Morris has been on the floor as ISU’s scoring point guard for 416 possessions of basketball, and in that time he has committed six turnovers.
—
Repeat: Villanova could repeat, this is not a drill

It’s likely this shot went in. (AP)
Big East                  W-L   Pace    PPP   Opp. PPP    EM
1.  Villanova             7-1   65.2    1.15    0.97    +0.18
2.  Creighton             5-2   70.6    1.14    1.06    +0.08
3.  Butler                6-2   66.1    1.11    1.05    +0.06
4.  Marquette             4-3   68.5    1.18    1.14    +0.04
5.  Xavier                4-3   71.2    1.09    1.05    +0.04
6.  Seton Hall            3-4   68.8    1.04    1.05    -0.01
7.  Georgetown            1-6   71.0    0.99    1.05    -0.06
8.  Providence            3-5   65.7    1.00    1.08    -0.08
9.  St. John's            3-5   72.5    0.99    1.09    -0.10
10. DePaul                1-6   66.5    0.96    1.11    -0.15

AVG.                            68.6    1.07
Acceleration since 2015:        6.0%
KenPom rank: 3
% of games played: 41
I’ve become convinced that on or about November 2013 Jay Wright figured something out about basketball, and it would be good if he would share it with the rest of us. Up until then Villanova’s had been a normal offense — good some years, less good others.
Then the Wildcats started making shots left and right. Observing the change in real time, I dutifully wrote up learned data-stuffed paeans to the uncanny shot-making abilities of Darrun Hilliard. This guy’s a game-changer! I said. Well, he’s long gone, and you may have noticed his alma mater went on to win an accuracy-enabled national title without him.
Now Ryan Arcidiacono and Daniel Ochefu have left the scene, Omari Spellman was ruled ineligible, Phil Booth is sidelined with tendonitis…and Villanova just keeps putting the ball in the basket.
Villanova accuracy, 2014-17
Conference games only
          eFG%      Big East rank
2014      55.6            2
2015      55.8            1
2016      54.4            1
2017      58.7 (so far)   1
Josh Hart stands a good chance of winning national player of the year, deservedly, in a setting where it’s nevertheless becoming apparent that the system may be the star. More importantly, Villanova could repeat. That sound you hear is all of us still not quite getting our heads around that fact, but a team that makes its shots and leads its league by a mile on defense is well suited for the task.
Steve Wojciechowski is cursed with the timing of a Phil Spector Christmas album. Marquette’s is an offense that can’t buy its “Aha!” moment nationally, though, granted, part of that’s been self-inflicted. First the Golden Eagles laid down 1.22 points per possession on the road at Butler. Highly impressive, only the Marquette defense forgot to show up after halftime, and the Bulldogs came away with the 88-80 win. Then this same offense put up a 1.28 at Creighton, won the game 102-94, and all it got Woj’s guys was a national consensus that the presence of 5-foot-10 Maurice Watson for the Bluejays would have surely prevented 6-foot-11 Luke Fischer from going 8-of-9 on his twos. Perhaps it would have; even so, this could turn out to be the best offense in the Big East. Villanova better bring its A game to Milwaukee tonight.
—
Northwestern is a public service announcement for shot volume
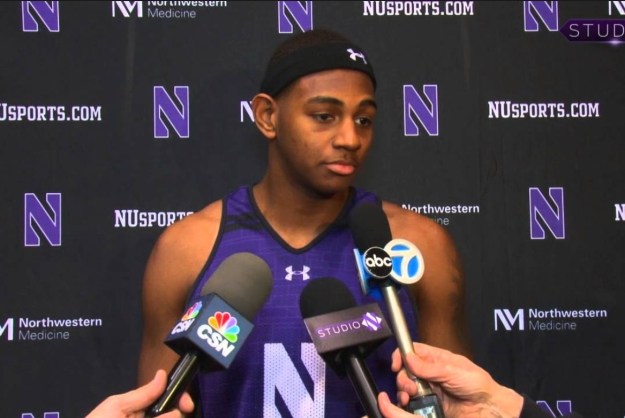
“Dererk, talk about how you despise non-interrogatory ‘talk about’ questions.”
Big Ten                   W-L   Pace    PPP   Opp. PPP    EM
1.  Purdue                5-2   70.8    1.11    0.97    +0.14
2.  Wisconsin             5-1   63.7    1.12    1.00    +0.12
3.  Northwestern          5-2   66.5    1.10    0.99    +0.11
4.  Maryland              5-1   69.0    1.08    0.97    +0.11
5.  Michigan State        4-3   67.7    1.03    0.96    +0.07
6.  Indiana               4-3   68.1    1.16    1.10    +0.06
7.  Minnesota             3-4   68.2    0.97    0.97     0.00
8.  Nebraska              3-4   68.2    1.07    1.08    -0.01
9.  Michigan              3-4   64.0    1.13    1.16    -0.03
10. Penn State            3-4   70.6    0.93    0.96    -0.03
11. Ohio State            2-5   69.0    1.01    1.09    -0.08
12. Iowa                  3-4   70.9    1.00    1.11    -0.11
13. Illinois              2-5   67.3    1.02    1.14    -0.12
14. Rutgers               1-6   69.7    0.84    1.03    -0.19

AVG.                            68.1    1.04
Acceleration since 2015:        9.3%
KenPom rank: 4
% of games played: 38
The transformation of Northwestern from a bunch of hard-luck ne’er-do-wells into an NCAA tournament almost-lock has been propelled by several factors, not the least of which have been 79 percent shooting at the line in Big Ten play and a mere 28 percent success rate from opponents on threes during that same time.
Both the offense and the defense have improved in Evanston since last season, but the leap forward made by the offense has been just a bit bigger and more impressive. In fact the Wildcat offense is better than it’s ever been during Chris Collins’ run.
And if you had to point to one factor driving Collins’ tenure-best offense, you would choose shot volume. After all, Northwestern’s shot better than this before, but we’ve never seen scoring anywhere close to this under Collins.
Northwestern shooting and offense
Conference games only
          eFG%     PPP            SVI
2017      50.1     1.10           99.4
2015      51.4     1.03           93.1
With the Wildcats holding on to the ball on almost 84 percent of their possessions and Dererk Pardon and Gavin Skelly more than holding their own on the offensive glass, this offense has been getting more bites at the scoring apple in Big Ten play than any team not named Wisconsin.
In fact Northwestern’s success perhaps suggests a way forward for this season’s hard-luck offense in the Big Ten. The team in question is far more accurate than the Wildcats from the field but is turning the ball over and recording a weak, almost “Northwestern until 2016”-like offensive rebound rate a full six percentage points lower than what Collins’ men are posting….
Shooting and offense
Conference games only
                          eFG%     PPP            SVI
Northwestern    2017      50.1     1.10           99.4
Michigan State  2017      52.7     1.03           92.3
Oh, how times have changed in the Big Ten.
—
Either Oregon will change its numbers or we’ll change our minds
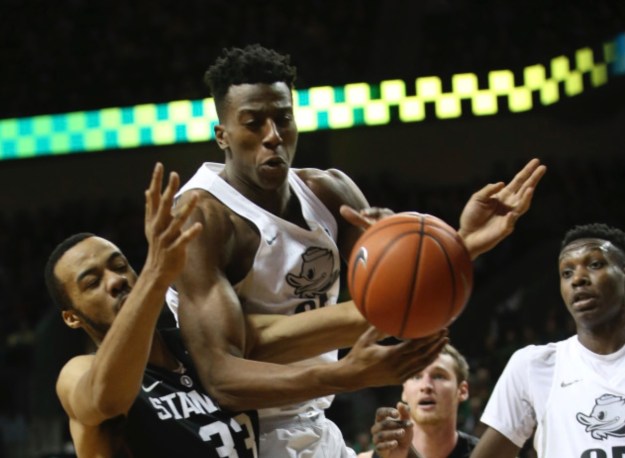
London native Kavell Bigby-Williams looks smashing in his side’s third kit during Saturday’s match against Stanford. Fancy a cuppa, KBW? (AP)
Pac-12                    W-L   Pace    PPP   Opp. PPP    EM
1.  Oregon                7-0   69.5    1.21    0.90    +0.31
2.  Arizona               7-0   69.1    1.17    0.97    +0.20
3.  Utah                  5-2   69.9    1.17    0.97    +0.20
4.  UCLA                  6-2   73.9    1.20    1.09    +0.11
5.  Cal                   5-3   65.4    1.05    1.04    +0.01
6.  USC                   4-4   68.9    1.01    1.06    -0.05
7.  Stanford              3-5   70.8    0.97    1.04    -0.07
8.  Washington            2-5   68.7    1.04    1.11    -0.07
9.  Colorado              0-7   69.3    1.07    1.17    -0.10
10. Arizona State         2-5   72.3    1.10    1.21    -0.11
11. Washington State      3-4   65.9    0.99    1.15    -0.16
12. Oregon State          0-7   63.8    0.89    1.17    -0.28

AVG.                            68.9    1.07
Acceleration since 2015:        5.2%
KenPom rank: 6
% of games played: 41
Laptops continue to be highly skeptical of an Oregon team that lost on a neutral floor to Georgetown (yes, it was Dillon Brooks’ first game back and he was weak as a kitten, asterisk duly noted) and that has compiled the beautiful numbers seen here against the league’s second-softest schedule. After all, isn’t that ridiculous scoring margin simply a function of hammering forlorn and defenseless Oregon State by an ungentlemanly 42 points?
Well, no, not really. Give that blowout a haircut all the way down to a mere 22-point win, and you’re still looking at an efficiency margin for the conference season (+0.27) that would be the envy of Arizona or UCLA. No, if you wish to be an Oregon skeptic you may be able to draw solace instead from actual basketball games.
Nobody noticed because the Ducks still won by 17, but, with Brooks again sidelined by a foot injury, Oregon’s offense recorded easily its worst game of the conference season at home against Stanford. Dana Altman’s guys coughed the ball up on 28 percent of their possessions, while 32 percent three-point shooter Chris Boucher was coaxed into launching seven tries from beyond the arc. He made two.
If a good but not great Cardinal defense can do that to a no-Brooks version of Oregon in Eugene, there could be grounds for evaluative caution as, Brooks or no Brooks, the Ducks prepare to navigate the Pac-12 schedule’s version of Amen Corner. First the dreaded altitude tour, with stops at surprisingly feisty Utah and way-better-than-its-record Colorado. Then back home to face Sean Miller and the Wildcats, before hitting the road again for a date at Pauley Pavilion. In 16 days this laptop-Tuesday Truths dissonance episode will be a thing of the past, one way or the other.
—
Why is this league drowning in free throws?
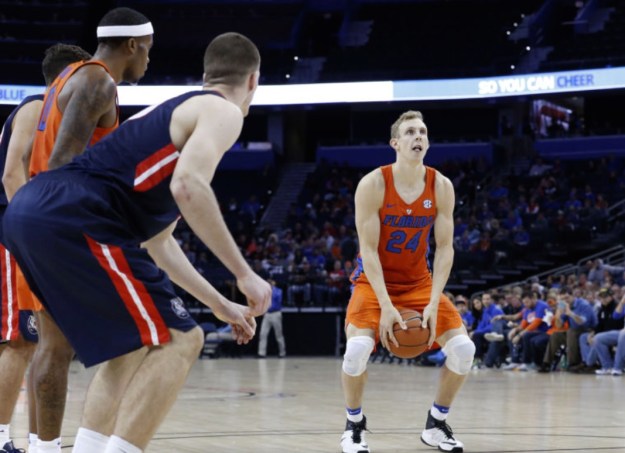
Give Canyon Barry credit, he chose the conference that would afford him by far the most opportunities to show off this stroke.
SEC                       W-L   Pace    PPP   Opp. PPP    EM
1.  Kentucky              7-0   74.6    1.24    0.97    +0.27
2.  Florida               5-2   68.7    1.05    0.97    +0.08
3.  Georgia               4-3   70.5    1.02    0.95    +0.07
4.  South Carolina        5-1   70.4    0.97    0.91    +0.06
5.  Alabama               4-2   69.1    0.98    0.96    +0.02
6.  Tennessee             2-3   71.3    1.06    1.06     0.00
7.  Vanderbilt            3-4   67.4    1.11    1.11     0.00
8.  Arkansas              4-3   71.6    1.11    1.11     0.00
9.  Mississippi State     3-3   72.9    1.05    1.06    -0.01
10. Auburn                3-4   73.4    1.05    1.10    -0.05
11. Ole Miss              3-4   74.1    0.93    1.02    -0.09
12. Texas A&M             2-5   68.9    0.96    1.05    -0.09
13. Missouri              0-6   74.0    0.93    1.06    -0.13
14. LSU                   1-6   75.2    1.03    1.17    -0.14

AVG.                            71.6    1.04
Acceleration since 2015:       11.7%
KenPom rank: 5
% of games played: 37
In conference play this season, the SEC has stood out from the rest of the major conferences in the degree to which the league loves, loves, loves free throws….
FTA/FGA
Conference games only

Pac-12          0.31
Big Ten         0.31
ACC             0.33
Big 12          0.35
Big East        0.36
SEC             0.42
This taste for foul shots makes the league a singular and dramatic exception to the overall major-conference rule, which, since the Great “New Rules” Whistlefest of 2014, has trended unmistakably toward fewer and fewer free throws. As a college basketball consumer I support said trend because: 1) free throws are boring; and 2) I’ve never understood why a star player driving the lane and flinging himself like a missile into the nearest stationary and peacefully vertical-cone-dwelling defender is so often classified as a violation by the defense.
Nevertheless, the SEC this season is on track to bring back the good old foul-filled days of 2014. If you’re one of those people who likes pointing fingers (I’m pointing at you), there are three referees on each floor and five teams in particular that appear to enjoy egging them on:
Opponent FTA/FGA
Conference games only

Missouri           0.47
South Carolina     0.48
Alabama            0.48
Arkansas           0.50
Tennessee          0.52
Actually the SEC’s distinctive on a number of fronts. In addition to being easily the fastest-paced major conference, it is also the worst-shooting such league — the only one, in fact, that’s converting at a rate under 35 percent on its threes. This is a conference of statistical extremes in ways that include but are not limited to its best team.
—
Tacko Fall is chasing history
American                  W-L   Pace    PPP   Opp. PPP    EM
1.  SMU                   7-1   61.9    1.20    0.95    +0.25
2.  Cincinnati            7-0   67.1    1.07    0.88    +0.19
3.  UCF                   5-2   68.9    1.01    0.91    +0.10
4.  Tulsa                 5-1   69.2    1.04    0.97    +0.07
5.  Memphis               5-2   68.7    0.97    0.91    +0.06
6.  Houston               4-4   62.8    1.04    1.02    +0.02
7.  Connecticut           3-4   61.9    0.96    0.99    -0.03
8.  Temple                1-6   67.2    0.96    1.06    -0.10
9.  East Carolina         1-6   64.2    0.85    1.01    -0.16
10. Tulane                1-6   72.5    0.94    1.13    -0.19
11. South Florida         0-7   70.1    0.86    1.07    -0.21

AVG.                            66.7    0.99
KenPom rank: 7
% of games played: 39
It’s been 36 years since Steve Johnson set the D-I season record for field-goal percentage by making 74.6 percent of his twos (the only kind of shots there were) for Oregon State in 1980-81. Now Johnson’s record is being threatened by not one but two players. At 7-foot-6, UCF’s Tacko Fall has connected on 79.1 percent of his twos. Throw in one missed three-point attempt on the season, and the well-traveled sophomore has an overall FG percentage of 78.5. Not to be outdone, UNC Wilmington’s Devontae Cacok has recorded a two-point accuracy rate of 78.7 percent while sensibly remaining aloof from any and all three-point attempts. As always in discussions of supernatural individual accuracy, volume is a key arbiter. Here’s how these three guys rank:
                         2FG%    2FGM/G
S. Johnson      1981     74.6     8.4
T. Fall         2017     79.1     5.6
D. Cacok        2017     78.7     5.1
Fall and Cacok have worked statistical wonders thus far, but besting Johnson over the course of a full season will be no small task. For his part the OSU legend saw his college career end in that year’s NCAA tournament, courtesy of a game-winner by Kansas State’s Rolando Blackman.
One of Blackman’s teammates on that K-State roster was current SMU head coach Tim Jankovich.
—
The Game of the Year of the week happens Friday night
A-10                      W-L   Pace    PPP   Opp. PPP    EM
1.  VCU                   5-2   70.0    1.11    0.92    +0.19
2.  Rhode Island          4-2   69.2    1.17    1.00    +0.17
3.  Dayton                6-1   70.4    1.01    0.86    +0.15
4.  St. Bonaventure       4-2   69.1    1.09    1.02    +0.07
5.  La Salle              5-2   68.0    1.11    1.09    +0.02
6.  Richmond              5-2   71.2    1.05    1.02    +0.03
7.  Davidson              2-4   68.4    1.05    1.06    -0.01
8.  George Mason          3-3   72.0    1.01    1.03    -0.02
9.  UMass                 2-5   74.6    0.95    0.99    -0.04
10. Saint Joseph's        2-4   69.9    0.92    0.98    -0.06
11. Fordham               3-4   67.4    0.94    1.01    -0.07
12. Duquesne              2-5   71.3    1.01    1.10    -0.09
13. George Washington     2-4   64.9    1.01    1.13    -0.12
14. Saint Louis           1-6   64.0    0.90    1.14    -0.24

AVG.                            69.3    1.02
KenPom rank: 8
% of games played: 37
After a frenzied first few weeks of Atlantic 10 play, Dayton’s emerged more or less as expected at the top of the standings as the league’s lone one-loss team. Charles Cooke’s had a lot to do with that. The hard-working 6-foot-5 wing carries the featured-scorer load for UD, rivals Scoochie “I have the best Bill Raftery name in D-I” Smith in terms of assist rate, and takes care of business on the defensive boards. The Flyers can put a bit of distance in between themselves and one of their many two-loss rivals with a road win Friday night at VCU (ESPN2, 9 ET). The Rams are 9-1 at home this season (they lost in overtime to Georgia Tech), and 24-3 as the host team since Will Wade arrived before last season. In A-10 play JeQuan Lewis and company have been up to their old Shaka-era tricks, forcing opponents to give the ball away on 22 percent of their possessions. (Though the league’s first-place team in this respect is actually Fordham, so direct any cool nicknames their way. “Bronx Zoom”?) Tune in for what promises to be an epic battle of the boards: VCU still believes in offensive rebounds, but Archie Miller, much like his brother in Tucson, places a really, really high premium on locking down the defensive glass.
—
Life on the borderline between multi- and one-bid
Missouri Valley           W-L   Pace    PPP   Opp. PPP    EM
1.  Wichita State         7-1   70.4    1.18    0.96    +0.22
2.  Illinois State        8-0   65.2    1.08    0.87    +0.21
3.  Southern Illinois     4-4   65.6    1.03    0.99    +0.04
4.  Missouri State        5-3   65.6    1.04    1.01    +0.03
5.  Loyola                4-4   67.6    1.08    1.08     0.00
6.  Northern Iowa         3-5   65.1    0.98    1.03    -0.05
7.  Drake                 4-4   71.9    1.06    1.12    -0.06
8.  Evansville            1-7   67.8    0.92    1.03    -0.11
9.  Bradley               3-5   68.2    0.95    1.06    -0.11
10. Indiana State         1-7   70.6    0.95    1.09    -0.14

AVG.                            67.8    1.02
KenPom rank: 10
% of games played: 44
The NCAA tournament selection process could be in for some modifications in the near future, but for 2017 things will have to go more or less the same way they went last year. (Side note. If we’re ever really going to revamp this process, I think we would kind of have to start in May. The inertia born of 37 years is considerable.) By these lights the Valley faces the next six weeks with a good deal of uncertainty. In traditional selection terms, Illinois State presents a good profile while Wichita State boasts a ranking at KenPom that no committee has had the stomach to refuse over the last decade. So the potential for two bids definitely exists, but it’s difficult to imagine a scenario — even up to and including an 18-0 run by the Redbirds that does not end with an auto-bid — where everyone in fact has two Valley teams safely in the brackets as we watch the selection show’s bracket get hacked by some anonymous mole on social media. (I kid, I kid. I’m sure it will be far smoother this time.) The question of one- vs. multi-bid is likely to be far more suspenseful than that for the Valley.
—
The table will continue to be run until further notice
West Coast                W-L   Pace    PPP   Opp. PPP    EM
1.  Gonzaga               8-0   68.7    1.24    0.89    +0.35
2.  Saint Mary's          7-1   60.8    1.16    0.96    +0.20
3.  BYU                   6-2   71.8    1.13    0.97    +0.16
4.  San Francisco         4-4   66.9    1.03    1.00    +0.03
5.  San Diego             3-5   65.1    1.00    1.02    -0.02
6.  Santa Clara           5-3   64.1    1.00    1.02    -0.02
7.  Loyola Marymount      2-6   67.7    0.98    1.08    -0.10
8.  Pacific               2-6   65.3    0.92    1.10    -0.18
9.  Pepperdine            1-7   69.3    0.96    1.17    -0.21
10. Portland              2-6   64.6    0.91    1.14    -0.23

AVG.                            66.4    1.03
KenPom rank: 11
% of games played: 44
Gonzaga just completed a two-game sweep of Portland, one that started with Saturday night’s 73-52 win over the Pilots in Spokane. With the two teams poised to play again just 48 hours later in Portland (to make up a game that had been rescheduled due to weather), I spied weak defensive rebounding on the part of the Bulldogs and engaged in the social-media equivalent of clearing one’s throat.
Portland loses by 21 @ Gonzaga but wreaks unforeseen havoc on offensive glass. Weather-delayed rematch tomorrow night in Portland. Hmm.
— John Gasaway (@JohnGasaway) January 22, 2017
The Zags won the rematch 83-64. Mark Few’s team is 20-0. I hereby retract my “Hmm.”
