
Welcome to Tuesday Truths, where I look at how well 120 teams in the nation’s top 10 conferences are doing against their league opponents on a per-possession basis.
North Carolina is (still!) vying to be Roy Williams’ best offensive rebounding team yet
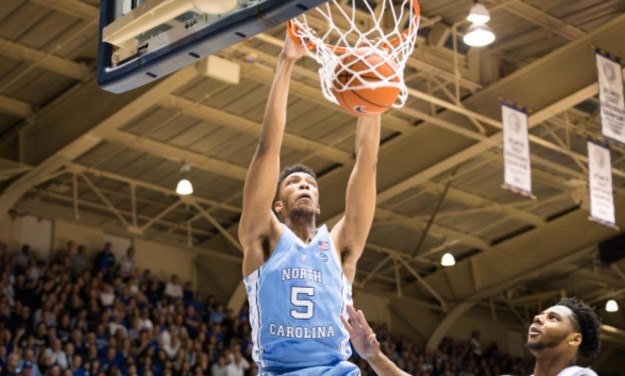
Could more minutes for Tony Bradley push UNC’s offensive rebounding even higher?
Through games of February 13, conference games only
Pace: possessions per 40 minutes
PPP: points per possession Opp. PPP: opponent PPP
EM: efficiency margin (PPP – Opp. PPP)
ACC                       W-L   Pace    PPP   Opp. PPP    EM
1.  Louisville            9-4   67.7    1.12    0.96    +0.16
2.  Virginia              8-4   62.0    1.09    0.97    +0.12
3.  North Carolina        9-3   72.2    1.16    1.06    +0.10
4.  Florida State         9-4   72.4    1.11    1.02    +0.09
5.  Duke                  8-4   70.4    1.14    1.06    +0.08
6.  Wake Forest           6-7   71.8    1.13    1.10    +0.03
7.  Notre Dame            8-5   67.9    1.09    1.07    +0.02
8.  Syracuse              8-6   66.5    1.13    1.12    +0.01
9.  Miami                 6-6   65.5    1.07    1.07     0.00
10. Georgia Tech          6-6   69.6    0.95    0.99    -0.04
11. Virginia Tech         6-6   69.6    1.05    1.12    -0.07
12. Clemson               3-9   67.0    1.05    1.15    -0.10
13. Boston College       2-11   71.5    1.01    1.12    -0.11
14. Pitt                  3-9   65.3    1.06    1.17    -0.11
15. NC State             3-10   72.3    1.03    1.19    -0.16

AVG.                            68.8    1.08
Acceleration since 2015:        8.9%
KenPom rank: 2
% of games played: 70
The last time we saw North Carolina, the Tar Heels were being limited to their worst offensive rebounding game of the ACC season by Duke. Yet even with that performance added to the mix, it’s conceivable that Kennedy Meeks, Isaiah Hicks, Tony Bradley and company will still turn out to be even better at crashing the offensive glass than any of their illustrious predecessors were.
Granted, this would be a strange occurrence in this of all seasons. Offensive rebounds have been charting a gradual but steady decline for years now in major-conference play. Maybe this is due in part to the vogue for stretch-5s, possibly it’s driven by an increasing emphasis on transition defense on the part of coaches, or perhaps it’s a combination of all of the above.
Whatever the reason, the offensive rebounding tide is receding in college basketball. Then again try telling that to the Tar Heels: Roy Williams’ men are pulling down almost as many misses as ever.
Best UNC offensive rebound percentages, 2004-17
Conference games only
          OR%           Leaders
2008     43.0           Hanbrough, Thompson, Green
2017     42.3 (so far)  Meeks, Hicks, Bradley, Maye
2009     41.4           Hansbrough, E. Davis, Thompson
2006     41.4           Hanbrough, Noel, Terry
2016     41.1           Meeks, Hicks, B. Johnson
2012     40.8           Zeller, Henson, McAdoo
UNC’s hegemony on the offensive boards is made even more potent because the Heels don’t squander too many offensive rebound opportunities by giving the ball away before there’s a shot attempt. As a result, Carolina is second to none in major-conference hoops when it comes to attempting shots en masse.
Turnover, offensive rebound %s; SVI
Major-conference games only
                      TO%    OR%     SVI
North Carolina        16.2   42.3   103.7
Louisville            15.7   34.0   100.3
Northwestern          15.6   31.0    99.1
Kentucky              16.0   31.8    99.0
Wisconsin             17.1   34.8    99.0
Division I may be giving up on offensive boards, but statistically extreme UNC is not.
—
The Big 12’s place in the historical pecking order

Master of close-game prowess and late-game miracle comebacks, he coaches the team that will likely win the title in what will likely be one of the strongest conferences of recent years. (John Sleezer, kcstar.com)
Big 12                    W-L   Pace    PPP   Opp. PPP    EM
1.  West Virginia         8-5   70.9    1.10    1.01    +0.09
2.  Baylor                9-4   64.9    1.06    0.99    +0.07
3.  Kansas               11-2   71.3    1.13    1.07    +0.06
4.  Iowa State            7-5   69.1    1.08    1.04    +0.04
5.  Oklahoma State        5-7   69.1    1.13    1.13     0.00
6.  Kansas State          5-7   69.3    1.04    1.06    -0.02
7.  TCU                   6-6   66.8    1.03    1.07    -0.04
8.  Texas Tech            5-8   65.0    1.06    1.10    -0.04
9.  Texas                 4-8   70.8    0.97    1.04    -0.07
10. Oklahoma             2-10   69.5    0.97    1.07    -0.10

AVG.                            68.7    1.06
Acceleration since 2015:        6.0%
KenPom rank: 1
% of games played: 69
I’m perfectly willing to award the prize of strongest conference in the nation to the Big 12 (its strength comes in part from having none of the weak teams you’re very likely to have when you let in 14 or 15 members), and in fact I’m so at peace with this selection that I wish to move on to a far more interesting matter. How strong is the Big 12 historically?
Very strong at KenPom, naturally, up there on the same bleachers as the hallowed 2004 ACC itself. But, again, we’re talking about a nine-team conference from 13 years ago versus a 10-team one now. My hunch is that small leagues tend to do well in measures of top-to-bottom strength, big ones do well in terms of sheer number of tournament bids, and, lastly, we mean a bit of all of the above in any discussion of conference strength.
For example when we say “best” conference what we’re really trying to get at is something more like “the league with the most great teams.” Well, the Big 12 put two No. 1 seeds in the preview bracket revealed by the NCAA last Saturday, so the league’s off to a strong start there.
I’ve been known to measure this aspect of a conference’s performance with seed points. By this fiendishly complex rubric, an NCAA tournament No. 1 seed is worth four points, a No. 2 gets you three, a No. 3 nets you two, and a No. 4 seed earns your league a single point.
So for example Saturday’s preview bracket spread its 40 points around like this:
2017 Preview Bracket
                  Seed pts
ACC                  12
Big 12                9
Pac-12                6
Big East              5
WCC                   4
SEC                   4
If present trends continue (which they usually do not), we could wrap up the season saying the Big 12 had two No. 1 seeds in Kansas and Baylor and easily the “best worst team” in the nation in Oklahoma (or Texas, or whomever), but the ACC flooded the top 16 lines of the NCAA bracket with the likes of North Carolina, Florida State, Louisville, Virginia and Duke. Handshakes all around.
Whether it’s the Big 12 or the ACC chasing the record, here are the strongest conferences of the tournament’s modern era (1985 to now) in terms of seed points:
                 Seed pts
Big East   2009     16
Big East   2010     14
Big East   2011     12
Many conferences have earned 11 seed points, starting with the Big Ten in 1987 and running up through the ACC last year.
To this year’s Big 12 and ACC, then, I say good luck chasing history. To the 2017 Big Ten, I say get at least one point.
—
Reports of the Bluejays’ death may have been greatly exaggerated

Maurice Watson has to like what he’s watching lately. (Joe Robbins/Getty)
Big East                  W-L   Pace    PPP   Opp. PPP    EM
1.  Villanova            12-2   65.8    1.15    0.98    +0.17
2.  Creighton             8-4   70.5    1.12    1.03    +0.09
3.  Xavier                8-4   69.4    1.09    1.06    +0.03
4.  Butler                8-5   66.3    1.08    1.05    +0.03
5.  Marquette             6-7   68.3    1.14    1.14     0.00
6.  Georgetown            5-8   69.3    1.03    1.03     0.00
7.  Seton Hall            5-7   68.1    1.00    1.02    -0.02
8.  Providence            5-8   65.5    1.02    1.08    -0.06
9.  St. John's            6-7   73.8    1.02    1.08    -0.06
10. DePaul               1-12   68.2    0.95    1.14    -0.19

AVG.                            68.6    1.06
Acceleration since 2015:        6.0%
KenPom rank: 3
% of games played: 71
Creighton has now played more Big East possessions without Maurice Watson being available (467) than the Bluejays recorded against conference foes with him heathy and in uniform (377). Meaning it’s high time to assess exactly what Greg McDermott’s team has been able to accomplish since the senior was lost for the year with a knee injury.
First the bad news for fans in Omaha: Creighton really is worse without Watson. (Big surprise, I know.) His absence has been felt both on offense and on defense — but, perhaps, not to the extent that some tweets the day he was injured would have had you believe.
Indeed it seems increasingly likely that the no-Watson version of the Bluejays is still the second-best team in the Big East.
Creighton with and without Watson
Conference games only       Pace    PPP   Opp. PPP    EM
1.  With Watson             68.9    1.13    1.01    +0.12
2.  Without                 71.9    1.11    1.04    +0.07
Sure, there are two games against DePaul helping the “without” numbers along, but 450-plus possessions is still a pretty good sample size and, anyway, no-Watson Creighton did win at Butler. The defending national champions wish they could say as much.
Since the senior’s injury (I started the “no Watson” clock at halftime of the win at Xavier on January 16), McDermott’s team has continued to shoot better than any team in the Big East up to and including Villanova itself. The post-injury Bluejays have connected on 53 percent of their twos and 43 percent of their threes. That’ll win you some games.
Speaking of threes, in a post-Watson world Creighton has benefited immensely from having shooters like Cole Huff, Toby Hegner and Isaiah Zierden on hand. CU’s more perimeter-oriented now than when it had the luxury of letting its point guard drive the ball all the way to the rim. It’s a different style, but it can work.
Plus Justin Patton and Marcus Foster. (Duh.) Creighton’s not going anywhere.
—
Indiana knows its way around performance swings
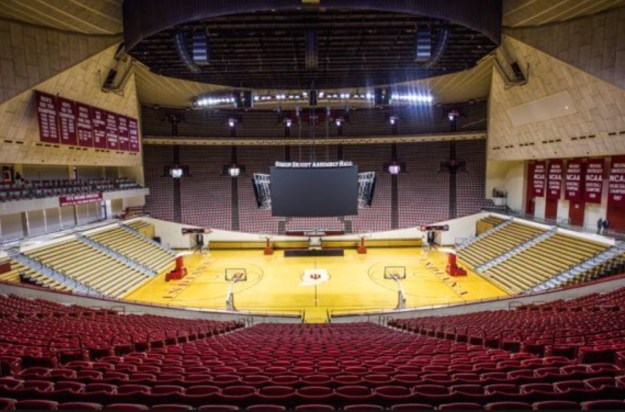
(insidethehall.com)
Big Ten                   W-L   Pace    PPP   Opp. PPP    EM
1.  Wisconsin            10-2   63.2    1.08    0.95    +0.13
2.  Purdue                9-3   70.1    1.11    0.99    +0.12
3.  Maryland              9-3   68.4    1.09    1.00    +0.09
4.  Michigan              6-6   63.7    1.16    1.10    +0.06
5.  Northwestern          8-4   66.4    1.05    1.00    +0.05
6.  Michigan State        7-5   67.1    1.04    1.01    +0.03
7.  Minnesota             6-6   68.2    1.02    1.00    +0.02
8.  Indiana               5-8   67.0    1.08    1.11    -0.03
9.  Penn State            6-7   69.7    0.97    1.01    -0.04
10. Nebraska              4-8   68.1    1.04    1.08    -0.04
12. Iowa                  6-7   70.8    1.03    1.08    -0.05
13. Ohio State            5-8   68.2    1.05    1.10    -0.05
13. Illinois              4-9   66.6    1.00    1.09    -0.09
14. Rutgers              2-11   68.4    0.87    1.03    -0.16

AVG.                            67.6    1.04
Acceleration since 2015:        8.5%
KenPom rank: 4
% of games played: 69
Since Michigan State won the Big Ten’s most recent national title in 2000, no program in the conference has seen anywhere near the swings in fortune that Indiana has endured over that span. Wisconsin and Rutgers are programmatically dependable each in their own way, but it has been the Hoosiers’ fate to touch both of those bases and to do so in fairly rapid succession, historically speaking.
This season the Hoosiers are currently winning 39 percent of their league games, just 11 months after this same program recorded a 15-3 march through conference play. That makes what we’re witnessing now the largest year-to-year decline in winning percentage posted by any Big Ten team this century — with the notable exception of IU in 2009. That was the year Indiana went 1-17 one season removed from Eric Gordon, a 14-4 record, an NCAA investigation, and a change in coaching regimes.
Losing OG Anunoby for the season and James Blackmon for four games did this team no favors, certainly, but now Blackmon’s back, and Thomas Bryant, Robert Johnson, Josh Newkirk, and Juwan Morgan have been here all along. What’s the problem?
In prosaic basketball terms, the issue is (still) turnovers. You might be able to get away with giving the ball away 23 percent of the time, or you might be able to get away with opponents committing turnovers on just 15 percent of their possessions. But it is really difficult to get away with both at the same time, as the Hoosiers have tried to do over the last six games. Simply redressing that imbalance would cure about 70 percent of what ails Indiana — in basketball terms.
But this probably isn’t purely or even primarily about basketball. The members of this team — players and coaches alike — don’t give the appearance of enjoying what they’re doing right now. Then again even in mid-February it’s not necessarily the case that this is the team’s natural or final state. Duke’s players and coachers weren’t enjoying themselves against NC State a few weeks ago, goodness knows, and the Blue Devils have bounced back nicely. Indiana knows its way around performance swings, and, right now, that qualifies as this team’s last best hope.
—
Your weekly UCLA 2017 defense vs. Louisville 2012 offense update!
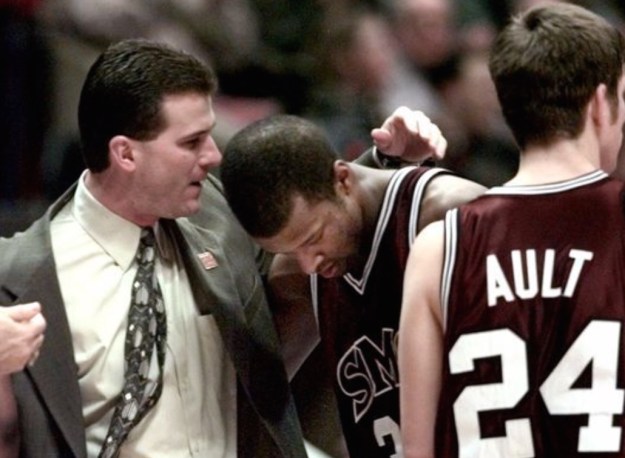
In 1999, Steve Alford’s Southwest Missouri State Bears reached the Sweet 16 with an awesome display of defense. Then again that team didn’t have two lottery picks.
Pac-12                    W-L   Pace    PPP   Opp. PPP    EM
1.  Oregon               11-2   67.8    1.17    0.97    +0.20
2.  Arizona              12-1   66.5    1.14    0.99    +0.15
3.  UCLA                 10-3   73.5    1.20    1.06    +0.14
4.  Utah                  8-5   69.3    1.12    1.00    +0.12
5.  Cal                   9-4   64.8    1.04    0.98    +0.06
6.  USC                   8-5   70.6    1.06    1.04    +0.02
7.  Colorado              5-8   68.8    1.11    1.09    +0.02
8.  Arizona State         5-8   71.5    1.07    1.14    -0.07
9.  Stanford              4-9   70.8    0.97    1.04    -0.07
10. Washington           2-11   70.7    0.99    1.15    -0.16
11. Washington State      4-9   67.8    1.00    1.17    -0.17
12. Oregon State         0-13   65.7    0.94    1.19    -0.25

AVG.                            69.0    1.07
Acceleration since 2015:        5.3%
KenPom rank: 6
% of games played: 72
People say UCLA’s fate is sealed because the Bruins’ defense is so bad. I say Steve Alford’s guys are not necessarily dead on arrival. I say their defense (which by the way is indeed really bad) is only as bad as the Louisville offense was five years ago, and that team somehow made it to the Final Four.
On Selection Sunday 2012, the Cardinal offense was ranked No. 122 in adjusted offensive efficiency at KenPom. That’s your post hoc ergo propter hoc Final Four floor right there, and as long as the Bruin defense can clear that low bar (which, for the moment, it does) then any doom-saying is premature.
Fine, this is a clear case of “do as I say not as I do.” Actually I proclaim doom all the time. Nevertheless, I do wonder whether there are two unconscious assumptions at work whenever we go through this “Entertainingly Talented Offensive Team Is Statistically Doomed” exercise (which recurs fairly often each January through March).
First, it’s interesting that we seldom do this same kind of extreme vetting for excellent defensive teams that are lacking on offense. No one bothers to say South Carolina is doomed, for example. We just take it for granted that they are even though the Gamecocks are No. 1 in the nation on defense.
Second, there’s a self-contradictory element inherent in the exercise itself, isn’t there? No one needs to throw 128 adjusted efficiencies from the last 64 Final Four entrants at a team that’s questionable on both sides of the ball. If you’re scrolling thorough that many KenPom screens in the first place, it suggests, paradoxically enough, that UCLA has an offense that’s so good that offsetting its defensive shortcomings isn’t entirely out of the question.
I saw a MEAC team beat a No. 2 seed in the 2012 round of 64, and now I’m supposed to believe Lonzo Ball winning a national title is not merely unlikely (which it is) but something closer to a categorical-impertaive “can’t happen”? Sorry, put me down as an efficiency-margin-first pluralist. Alford’s guys could give up 1.30 points per trip and conceivably persuade me not to care, just as long as they’re scoring 1.50.
—
A clear top five…wait, what?
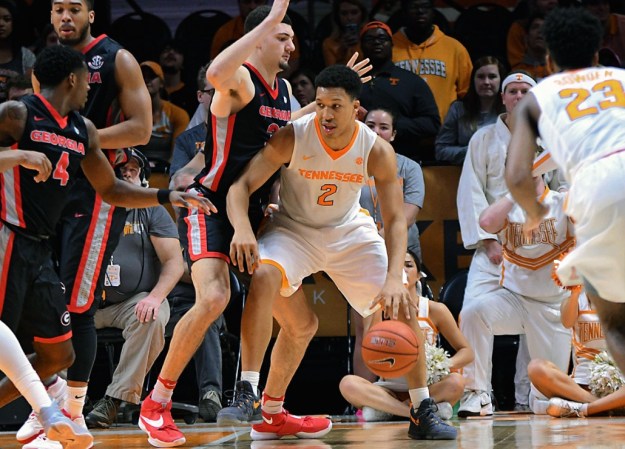
I don’t know if he’ll go dancing, but Grant Williams is having a very good freshman season. (USA Today)
SEC                       W-L   Pace    PPP   Opp. PPP    EM
1.  Florida              10-2   71.0    1.10    0.91    +0.19
2.  Kentucky             10-2   74.7    1.15    1.00    +0.15
3.  South Carolina       10-2   71.0    1.01    0.91    +0.10
4.  Tennessee             6-6   72.3    1.04    1.03    +0.01
5.  Arkansas              7-5   70.6    1.10    1.09    +0.01
6.  Alabama               7-5   69.0    0.99    0.98    +0.01
7.  Vanderbilt            5-7   66.6    1.08    1.08     0.00
8.  Georgia               5-7   69.8    1.01    1.02    -0.01
9.  Ole Miss              6-6   73.9    1.00    1.02    -0.02
10. Mississippi State     5-7   72.5    1.03    1.07    -0.04
11. Texas A&M             5-7   68.6    1.00    1.05    -0.05
12. Auburn                5-7   75.6    1.05    1.11    -0.06
13. Missouri             2-10   71.2    0.96    1.08    -0.12
14. LSU                  1-11   75.1    1.00    1.18    -0.18

AVG.                            71.6    1.04
Acceleration since 2015:       11.7%
KenPom rank: 5
% of games played: 67
After earning just two at-large bids in three of the last four selections, the SEC made moves in the offseason to try to improve the league’s luck with the committee. I dare say the fact that Tennessee and Arkansas are currently being included in a fair number of mock brackets suggests those efforts have already borne fruit.
First, a confession. Every season I busy myself with tracking teams and not only form some tentative assumptions on what we may see moving forward but also reach some definitive conclusions regarding what has already taken place. Then, inevitably, I take my first look at a mock bracket, check some projected seeds, and recoil in horror. Where are they getting this stuff?
The overly simplistic answer here is the three-letter antique, and maybe my annual recoil will be a thing of the past as soon as next season. For now, however, my 2017 full-body shudder has two points of reference with particular interest to the SEC….
Tennessee has possibly Division I’s most impressive “Yep! We lost to those guys!” list, one that includes Gonzaga, North Carolina (great game in Chapel Hill — salute), Oregon, and Wisconsin. No one can accuse the Volunteers of not scheduling up. So, yes, let’s say I recognize the vein of thought that lands Rick Barnes’ guys in the discussion as, for better or worse, a fixture of some duration on our selection landscape.
Arkansas, on the other hand, still frankly baffles me. While I shout pie-in-the-sky theoretical exhortations from the sidelines, my colleague Eamonn Brennan actually gets in the arena and coats himself head-to-toe with bubble praxis — antique and all — every February. So when even he says the Razorbacks’ best (best!) wins were at Tennessee and Vanderbilt …I…don’t really see a need to end this sentence….
Except perhaps to say way to go, at-large-voodoo SEC masterminds. Impressive work, indeed.
—
SMU has applied for a trademark on “The University of South Kansas”
American                  W-L   Pace    PPP   Opp. PPP    EM
1.  SMU                  12-1   62.6    1.16    0.90    +0.26
2.  Cincinnati           11-1   64.7    1.08    0.89    +0.19
3.  Houston               9-4   64.5    1.09    0.98    +0.11
4.  Connecticut           7-5   63.7    1.05    0.98    +0.07
5.  Memphis               8-5   67.9    0.98    0.94    +0.04
6.  UCF                   6-7   67.1    0.99    0.97    +0.02
7.  Tulsa                 6-6   67.3    0.98    1.00    -0.02
8.  Temple                5-8   67.3    1.01    1.05    -0.04
9.  East Carolina         3-9   65.3    0.86    1.01    -0.15
10. Tulane               1-11   71.6    0.92    1.12    -0.20
11. South Florida        1-12   68.5    0.90    1.15    -0.25

AVG.                            66.4    1.00
KenPom rank: 7
% of games played: 69
Perhaps after the season when Bill Self catches up with his former assistant Tim Jaknovich, the two coaches will enact a version of the meeting where Carl Jung’s said to have told a particularly fervent young disciple, “You’re more Jungian than I am.” There are just two problems with my imagined scene. First, the story probably never happened, and, second, Jankovich is actually four years older than Self.
What I will say is that right now Jankovich’s SMU defense looks way more like Kansas than Kansas does. On Sunday the Mustangs won their showdown against Cincinnati in Dallas by holding the Bearcats to 51 points in 54 possessions. (This game was actually as slow as I thought Gonzaga-Saint Mary’s was going to be. Go figure.) The Ponies can’t touch Mick Cronin’s guys when it comes to forcing misses in the paint, but Southern Methodist is getting this defense thing done the KU way. SMU’s a close second behind UC in interior D, and on top of that Ben Moore and Sterling Brown absolutely own the defensive boards just like Thomas Robinson, the Morrii, and Darnell Jackson did back in the day in Lawrence.
Now for the obligatory word of forward-looking caution. That game Saturday at Houston will be no walk in the park. The Cougars have won five straight against Tacko Fall and shorter humans by taking fanatically good care of the ball and hitting their threes. SMU does tend to allow opponents to try their luck from out there: 32 of Cincinnati’s 49 shot attempts were launched from beyond the arc.
Forget Kansas, build a big beautiful wall around the Land of Lincoln…and adjacent counties. A Chicagoland native (albeit from across the state line), Jankovich served one season as Self’s assistant at Illinois (before moving with him to KU), piloted the Illinois State program as head coach for five seasons, and can currently be found on the sidelines in Dallas smiling knowingly while graduates of Bolingbrook and Proviso East beat opponents to a pulp on SMU’s defensive glass. Lovie Smith should get his pick of Lone Star all-staters as compensation.
—
Looking like a two-bid league, unless….
A-10                      W-L   Pace    PPP   Opp. PPP    EM
1.  VCU                  10-2   68.1    1.10    0.95    +0.15
2.  Dayton               10-2   68.7    1.07    0.92    +0.15
3.  Rhode Island          8-4   70.0    1.09    0.97    +0.12
4.  Richmond              9-3   72.5    1.06    1.00    +0.06
5.  St. Bonaventure       7-5   68.4    1.04    1.01    +0.03
6.  Davidson              5-7   68.8    1.03    1.02    +0.01
7.  George Mason          7-5   69.7    1.05    1.04    +0.01
8.  La Salle              7-5   68.7    1.07    1.07     0.00
9.  UMass                 3-9   73.1    0.99    1.03    -0.04
10. George Washington     5-7   65.6    1.04    1.08    -0.04
11. Saint Joseph's        3-9   68.5    0.97    1.05    -0.08
12. Fordham               4-8   66.5    0.96    1.06    -0.10
13. Duquesne             2-10   71.0    1.00    1.14    -0.14
14. Saint Louis           4-8   63.4    0.97    1.12    -0.15

AVG.                            68.8    1.03
KenPom rank: 8
% of games played: 67
In the A-10 standings and in the mock brackets, Dayton and VCU stand apart from the rest of the league. In performance terms, Rhode Island has a strong me-too case to make for inclusion. That’s why the final moments of the game against the Flyers last Friday night in Kingston loomed so large for the Rams….
The A-10 really puts an emphasis on the last second of the 40 minutes.
— John Gasaway (@JohnGasaway) February 11, 2017
URI lost to Archie Miller’s men 75-74 when a Ram inbounds pass with 1.4 seconds remaining went AWOL. Now Dan Hurley’s team will pin its hopes on a win next weekend when VCU comes for a visit, but even that eventuality likely falls in the “necessary but not sufficient” category for an at-large. Throw a stick at the ACC and you’ll hit four or five teams equal in laptop heft to Rhode Island but with home opportunities against some of the best teams in the country.
At least we know in advance that this latest Battle of the Rams (VCU vs. URI) will most certainly come down to the last second.
Shooting twos about as well as UCLA does is a very good thing. In A-10 play Richmond’s the best shooting team in the league by a mile, and, as seen above, the Spiders are slightly above average on D. Alas, shot volume does matter, or, more precisely, a mere sufficiency in the category’s required even though it’s no panacea by itself.
—
Forecasting Shocker defensive performance against normal opponents
Missouri Valley           W-L   Pace    PPP   Opp. PPP    EM
1.  Wichita State        13-1   69.5    1.17    0.90    +0.27
2.  Illinois State       13-1   65.5    1.04    0.89    +0.15
3.  Loyola                6-8   66.1    1.07    1.06    +0.01
4.  Northern Iowa         8-6   64.7    0.95    0.95     0.00
5.  Southern Illinois     7-7   65.6    1.01    1.02    -0.01
6.  Missouri State        6-8   65.5    1.02    1.04    -0.02
7.  Evansville           4-10   66.9    0.96    1.02    -0.06
8.  Indiana State        4-10   69.7    0.97    1.05    -0.08
9.  Drake                 5-9   71.3    0.99    1.10    -0.11
10. Bradley              4-10   68.6    0.90    1.03    -0.13

AVG.                            67.3    1.01
KenPom rank: 10
% of games played: 78
The Missouri Valley is not untouched by stylistic extremism on offense. Northern Iowa, a completely normal group on the defensive glass, is choosing to rebound just 17 percent of its misses in conference play, and over that same span Evansville has devoted just 20 percent of its shot attempts to threes (while putting together a three-game win streak — I see you, Purple Aces). I guess what I’m saying is coaches in the Valley tend to be rather emphatic in their preferences. The shadow of a former Indiana head coach who was not untouched by such emphases looms large and, ironically enough, that of a far more stylistically flexible former Indiana State head coach does not.
My working assumption these past few seasons has been that stylistic extremism on the part of opponents has added a two or three percent performance boost to what of course would already have been Wichita State’s domination of the conference. Most notably, your defense is going to look better than it otherwise would when the other team doesn’t try for offensive rebounds. This same dynamic is helping Gonzaga too, naturally (the WCC’s even more allergic to offensive boards than the MVC), but the Bulldogs’ conference opponent effective field goal percentage is a full three points lower than what the Shockers have recorded.
Throw in the fact that WSU’s Valley opponents have hit just 33 percent of their threes while attempting a high number of such shots (remarkable given that the aforementioned three-phobic Aces will account for 11 percent of the minutes played against this defense), and you have all the ingredients for a March surprise. Could a tournament opponent excel against this Wichita State defense, in part, though such otherwise mundane activities as making some threes and trying for some offensive rebounds?
My streak of posts without a pun on Normal, Illinois, continues. MiKyle McIntosh was said to be on-course to miss three weeks when he was injured two weeks ago. (For his part ISU head coach Dan Muller is being coy and secretive. It’s true! “We don’t really have much of a schedule,” Muller said this week. “When he’s ready, he’ll play.”) If McIntosh does come back full-strength, Illinois State can boost its at-large chances from faint to slim. Or just win Arch Madness. That works too.
—
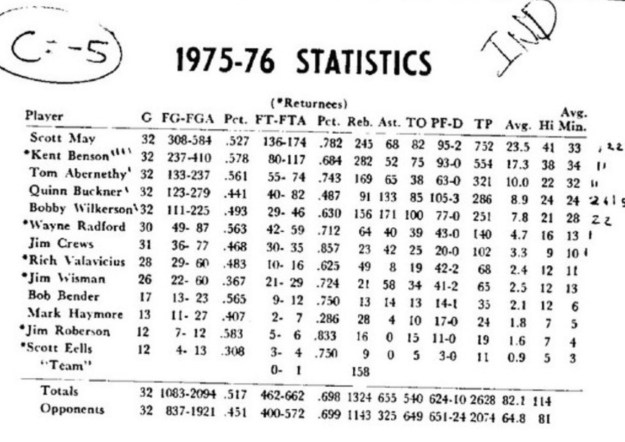
Let the 1976 comparisons begin
West Coast                W-L   Pace    PPP   Opp. PPP    EM
1.  Gonzaga              14-0   69.6    1.23    0.86    +0.37
2.  Saint Mary's         12-2   59.6    1.16    0.94    +0.22
3.  BYU                   9-5   73.9    1.06    0.97    +0.09
4.  San Francisco         8-6   67.3    1.00    0.96    +0.04
5.  Santa Clara           8-6   63.3    1.00    1.02    -0.02
6.  Loyola Marymount      5-9   69.9    0.97    1.04    -0.07
7.  San Diego            4-10   62.8    0.94    1.06    -0.12
8.  Pepperdine            5-9   69.3    0.99    1.13    -0.14
9.  Pacific              3-11   65.2    0.95    1.11    -0.16
10. Portland             2-12   63.7    0.89    1.11    -0.22

AVG.                            66.4    1.02
KenPom rank: 11
% of games played: 78
In 1975-76, Indiana outscored its opponents by an average of 17.3 points per game. For Gonzaga this season that number so far is 23.9.
Yes, the Big Ten in 1976 was tougher than the WCC in 2017. The Hoosiers faced Michigan in the national championship game, after all, while it is unlikely that the Bulldogs will have to confront a league rival in Phoenix.
Then again the Zags are No. 1 at KenPom and, more importantly, Mark Few’s guys hold that distinction by an unusually large margin in historical terms. That doesn’t mean Gonzaga will win the national title — Kentucky didn’t in 2015 — but, to repeat a hard-won lesson applicable to the Wildcats in most SEC seasons, when a great team’s trapped in a conference that can’t fight back we don’t throw up our analytic hands and stomp off. We set about trying to find out what we can.
Verb tense is important. If one more commentator says Zach Collins is “going to be” good, so help me I will beat them about the head and shoulders with a sock filled with game tape. Collins is saluting smartly and accepting the 17 minutes a game he’s being doled out behind and, at times, alongside Przemek Karnowski. During those 17 minutes the freshman is the functional equivalent of a clear-cut one-and-done big man both offensively and defensively. If Duke had recruited Collins in addition to his teammate at Bishop Gorman, I could get enthused about the Blue Devils’ chances to live up to that preseason ranking after all.
