
Welcome to Tuesday Truths, where I look at how well 120 teams in the nation’s top 10 conferences are doing against their league opponents on a per-possession basis.
A theory of Duke
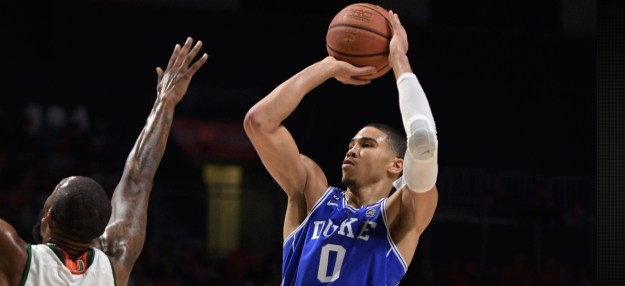
One of the better looks Jayson Tatum and the Blue Devils got against Miami. (Lance King)
Through games of February 27, conference games only
Pace: possessions per 40 minutes
PPP: points per possession Opp. PPP: opponent PPP
EM: efficiency margin (PPP – Opp. PPP)
ACC                       W-L   Pace    PPP   Opp. PPP    EM
1.  Louisville           11-5   67.9    1.13    0.99    +0.14
2.  North Carolina       13-4   70.1    1.15    1.02    +0.13
3.  Florida State        11-5   71.8    1.13    1.03    +0.10
4.  Virginia             10-7   60.7    1.04    0.96    +0.08
5.  Duke                 10-6   68.5    1.14    1.08    +0.06
6.  Notre Dame           11-5   68.0    1.10    1.06    +0.04
7.  Miami                10-7   63.7    1.06    1.04    +0.02
8.  Wake Forest           7-9   71.9    1.12    1.11    +0.01
9.  Syracuse              9-8   66.8    1.11    1.12    -0.01
10. Virginia Tech        10-7   67.6    1.10    1.13    -0.03
11. Georgia Tech          7-9   69.1    0.95    0.99    -0.04
12. Clemson              4-12   66.8    1.07    1.15    -0.08
13. Pitt                 4-12   65.1    1.06    1.15    -0.09
14. Boston College       2-14   72.0    1.01    1.15    -0.14
15. NC State             4-13   71.2    1.02    1.18    -0.16

AVG.                            68.1    1.08
Acceleration since 2015:        7.8%
KenPom rank: 2
% of games played: 91
For all we know Duke could yet win the 2017 national championship — way stranger things have happened — but invoking those trusty Stranger Things is surely not a good sign. Besides, everyone and I do mean (almost) everyone thought the Blue Devils would look much better by now than they do in the numbers shown above. What has happened so far?
Mike Krzyzewski’s team has suffered from severe and possibly debilitating discontinuities in personnel all season long, of course. This dynamic made itself felt, not least, with the absence of Mike Krzyzewski himself for seven games, and has run all the way up through the team’s most recent outing, one that was played sans Grayson Allen. Very well, the question now becomes how have those discontinuities made themselves felt in terms of on-court performance.
Good question. In many ways this tumultuous season actually bears a fair resemblance to a notably successful campaign from two years ago.
Duke now and then
Conference games only
                                ACC rank
         2FG%    3FG%    TO%    Opp. PPP
2017     52.1    39.0   17.2        8
2015     53.1    39.9   17.0        7
If the Blue Devils are shooting nearly as well as they did two seasons ago (take a bow, Luke Kennard), holding on to the rock with a fair degree of success, and once again looking meh on defense but, once again, showing signs of potential late-season improvement (it seems like we do this every year with these guys) then what, precisely, is the problem?
One issue is shot volume, or, more specifically, offensive rebounding. Another is rim defense.
The numbers are down down low
Conference games only
Offensive rebound %, shot volume index (SVI), opponent 2FG%
                          Opp.
          OR%     SVI     2FG%
2017     31.3     97.3    51.3
2015     36.9    100.2    47.4
Through all the tumult and upheaval, the guys outside the paint in Durham have largely held up their end of the bargain in 2017. They’re shooting well, hitting the league average in terms of turnovers, and — most emphatically — shooing opponents off the three-point line. (Duke has lucked out to the extent that opposing offenses have clanged such a high percentage of their rare threes. Thus the somewhat deceptive overall number for the meh defense. It could be worse than meh.) Yet here the Blue Devils are, on track to be seeded as possibly the third- or fourth-best team out of the ACC.
Not a terrible fate, all in all, but not exactly what was expected either. What was expected was that this group would look more 2015-like. On paper, that could still happen with the timely addition of some offensive boards and a few more forced misses inside the arc. On the court, the beginning of March is a rather late moment to still be scanning the horizon for the arrival of new capabilities.
—
Continuing series: Oklahoma State would be one profoundly scary No. 7 seed

Phil Forte has the Big 12’s best offensive rating in conference play. (Tulsa World)
Big 12                    W-L   Pace    PPP   Opp. PPP    EM
1.  West Virginia        11-6   69.7    1.08    0.99    +0.09
2.  Kansas               15-2   70.8    1.12    1.04    +0.08
3.  Baylor               11-6   64.1    1.06    1.00    +0.06
4.  Iowa State           11-5   68.1    1.11    1.06    +0.05
5.  Oklahoma State        9-7   68.7    1.15    1.12    +0.03
6.  Oklahoma             4-13   69.8    0.98    1.04    -0.06
7.  TCU                  6-10   66.8    1.02    1.08    -0.06
8.  Kansas State         6-10   69.0    1.02    1.08    -0.06
9.  Texas Tech           5-11   65.1    1.04    1.10    -0.06
10. Texas                4-12   69.5    0.97    1.05    -0.08

AVG.                            68.2    1.06
Acceleration since 2015:        5.2%
KenPom rank: 1
% of games played: 91
This will be brief because I have the indolent luxury of pointing at something I’ve already written: Oklahoma State should frighten any No. 2 or, potentially, No. 1 seed that the Cowboys run across next month.
Granted, this may be a moot point. Brad Underwood’s guys have been winning 91 percent of the time under our current president (counting the non-conference win against Arkansas), and if they keep this up for the balance of the next 12 days there’s little chance they’d be seeded as low as the No. 7 much less No. 8 line. Still, whether it’s in the round of 32 or the Sweet 16, an opposing coach like Mark Few or Jay Wright or whomever won’t have to work particularly hard to warn his team about the gravity of the situation….
Failing OSU opponents are losers, just like Arnold and Bernie — highly lamentable!
Since January 20
Conference games only
                    W-L   PPP     3FG%     OR%
Oklahoma State      9-1   1.20    43.0    36.2
No, the OSU defense’s not going to occasion any instructional videos (unless it’s a Scared Straight kind of thing), but over this 10-game stretch it’s been keeping pace with the Big 12 average more or less. In fact this in-season improvement on D could give you precious bracket leverage over newbies who will descend en masse on KenPom on Selection Sunday. They’ll see the Cowboys’ awful ranking for adjusted defensive efficiency (if you’re lucky it’ll still be in the triple digits), engage in fussy January-UCLA-defense-variety statistical fatalism, and run away from the Pokes as fast as bracket-ly possible.
Who knows, depending on the opponent that may be the right call. Not to mention Oklahoma State’s remaining schedule is no cake walk: Iowa State in Ames tonight, and Kansas in Stillwater on Saturday. An 0-2 finish to the regular season is entirely possible. Just remember to give this team a look that goes beyond what the seed and the whole-season numbers are telling you.
—
Georgetown’s statistically common situation is atmospherically unique
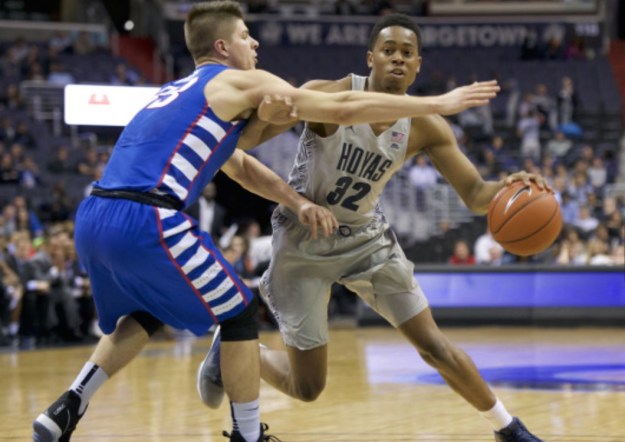
Lost to DePaul? Best effective field goal percentage defense in the Big East? Take one step forward if you answered “yes” to both. (USATSI)
Big East                  W-L   Pace    PPP   Opp. PPP    EM
1.  Villanova            14-3   65.7    1.16    0.99    +0.17
2.  Butler               12-5   66.9    1.13    1.06    +0.07
3.  Creighton             9-7   70.6    1.10    1.04    +0.06
4.  Marquette             8-8   68.7    1.14    1.10    +0.04
5.  Seton Hall            8-8   68.3    1.03    1.05    -0.02
6.  Georgetown           5-11   69.8    1.02    1.04    -0.02
7.  Xavier                8-8   68.6    1.07    1.09    -0.02
8.  Providence            8-8   66.3    1.04    1.06    -0.02
9.  St. John's            7-9   74.4    1.03    1.11    -0.08
10. DePaul               2-14   68.0    0.97    1.14    -0.17

AVG.                            68.7    1.07
Acceleration since 2015:        6.2%
KenPom rank: 3
% of games played: 91
The numbers say Georgetown has performed exactly as well in Big East play as a Xavier team currently in post-Sumner free fall or as a Providence team now enjoying a well-deserved Bubble Darling of the Week moment. (Jalen Lindsey is fast becoming the Big East’s version of Phil Forte.) Too bad numbers don’t win games: John Thompson III’s team is six games under .500 in conference play for the first time in his 13-year tenure.
It’s enough to make one question whether defending the basket really matters. The Hoyas’ Big East opponents have connected on 47 percent of their twos and 35 percent of their threes. That makes Georgetown’s the top field-goal defense in the league by a hair over Villanova. Speaking of things that don’t win games, a foul-prone defense that forces misses but very few turnovers is no silver bullet when paired with a turnover-prone offense that struggles to make threes. Indeed the Hoyas may emerge from their league’s revealing round-robin MRI with the Big East’s worst offense not named “DePaul.”
Jessie Govan began his college career by making 19 of his first 35 three-pointers over roughly a season-and-a-half. Now the career 51 percent foul shooter is connecting just 29 percent of the time from beyond the arc in conference play. The hoops gods must be laughing. Thompson’s best play call in 2017 is perhaps to tell L.J. Peak to get fouled.
Add to all of the above the fact that Georgetown is the close-game anti-Kansas, and you have a recipe for a full-blown collapse. The Hoyas are 2-6 in Big East games decided by single digits, a mark that includes an 0-2 track record in contests that go to overtime.
Thompson made his out-from-his-dad’s-shadow bones with a 2007 team that went to the Final Four by doing everything, good and bad, in abundance. Jeff Green, Roy Hibbert and company were, by 2017 standards, outrageously careless with the ball, giving the rock away on nearly a quarter of their Big East possessions. Then again that same group of Hoyas was one of the most accurate major-conference offenses we’ve seen in the last decade, not to mention one that rebounded 41 percent of its rare misses. Now, 10 years later, the only thing in abundance in DC is impatience.
Continuing coverage of a season that happened a decade ago. Remove turnovers from the equation, and Georgetown in 2007 may have had the best offense…ever? Put it this way, the Hoyas’ number for points per “effective” (turnover-less) possession in Big East play that year was 1.49. Good luck equaling that figure. It’s been 10 years and counting and no team has done so in major-conference play. The closest number you’ll find this year would be Oklahoma State at 1.43. Did I mention high seeds should fear the Cowboys?
—
Purdue Pete says let 13 other teams eat cake

Carsen Edwards is sad, but the Boilermakers are still the Big Ten’s leader in the clubhouse for Most Likely to Be Good. (Alex Kumar)
Big Ten                   W-L   Pace    PPP   Opp. PPP    EM
1.  Purdue               12-4   69.6    1.10    0.98    +0.12
2.  Wisconsin            11-5   63.6    1.07    0.99    +0.08
3.  Michigan              9-7   63.8    1.14    1.08    +0.06
4.  Maryland             10-6   68.3    1.08    1.04    +0.04
5.  Minnesota            10-6   69.3    1.04    1.00    +0.04
6.  Michigan State       10-6   68.2    1.05    1.01    +0.04
7.  Northwestern          9-7   65.9    1.03    1.01    +0.02
8.  Iowa                  8-8   70.6    1.05    1.07    -0.02
9.  Indiana              6-10   67.8    1.07    1.10    -0.03
10. Illinois              7-9   66.9    1.00    1.04    -0.04
11. Ohio State           6-10   67.8    1.05    1.09    -0.04
12. Nebraska             6-10   68.6    1.02    1.06    -0.04
13. Penn State           6-10   69.9    0.97    1.02    -0.05
14. Rutgers              2-14   67.6    0.88    1.04    -0.16

AVG.                            67.7    1.04
Acceleration since 2015:        8.7%
KenPom rank: 4
% of games played: 89
Wisconsin, Maryland and, of course, Northwestern have all taken their turns this season as the Big Ten “It” teams of the moment. But now, as March dawns, the Badgers, Terrapins and Wildcats are a combined 2-7 over their last nine games.
Greg Gard’s men have inherited Michigan’s early-conference-season “opponents never miss their threes” curse whilst losing the range from pretty much everywhere in their own right. (Bronson Koenig is mired in a 7-of-28 bog on his threes.) Never mind that “0.99” under points allowed in that table above, the Badgers’ last five opponents have actually torched this D for 1.11 points per trip.
Meanwhile Maryland’s lost three of its last four home games, the latest indignity being a 14-point thrashing at the Xfinity Center courtesy of the hitherto “young” and “reset-year” Iowa Hawkeyes. The Terrapins are fairly drowning in opponents’ shot attempts. When you pull down just 64 percent of the other teams’ misses and those opponents are giving the ball away just 12 percent of the time (such numbers being what the Terps have recorded over their last three games), you’re yielding a sheer volume of scoring opportunities that not even pre-UVa-game North Carolina could generate for itself.
Lastly there’s Northwestern, a great story waiting to happen if only the Wildcats would cooperate. The weird and severe turnover-free offensive funk suffered recently by Virginia was actually presaged by Chris Collins’ guys. Over their last seven games the Cats are shooting percentages of just 44 and 29 from inside and beyond the arc, respectively. For a while it seemed plausible that a contributing factor here was Scottie Lindsey’s absence, but since his return the man himself is just 9-of-34 from the field. Whatever his teammates came down with while he was out is apparently contagious.
That leaves Purdue nominally above the fray, yet even the Boilermakers got smacked with a 12-point loss at Michigan over the weekend. Still, Matt Painter’s guys are likely the last best hope for anything remotely resembling a sun king from this league. The Boilers’ steadfast refusal to give opponents any offensive rebounds at all has had the condign virtue of being (mostly) transferrable across venues and months. It could work next month too.
The Illini have nothing to lose but their pains. Momentum in this league clearly resides with what was previously a quiescent rabble that has now fairly stormed the B1G bastille: Michigan, Minnesota, Iowa, and…Illinois? Yes, Illinois. The men from Champaign have won four of their last five by holding opponents to 44 percent shooting on their twos and a mere 0.93 points per trip. No one has noticed except, naturally, Illini fans who are busy constructing intricate scenarios wherein Illinois wins out, finishes 9-9, gets a victory or even two in the Big Ten tournament and then, yes, goes dancing. These fans are of course quite mad, in both senses of the term. That is to say they are college basketball fans.
For the record those remaining games are at home against Michigan State tomorrow night and on the road Saturday at Rutgers. It’s true a .500 record in the Big Ten’s been good enough for a bid 59 percent of the time in the NCAA tournament’s modern era. Then again look what happened to Ohio State last year at 11-7. The only foregone conclusion here is casuistry in the event of a win over the Spartans. In the presidential election of 1828 the transitive property was made to work overtime when Democrats said their candidate had won on the battlefield against a foe that had defeated Napoleon. Well, Illinois beat the team that just won at Gonzaga. So there’s that.
—
UCLA shoots two-point jumpers, but its point guard does not
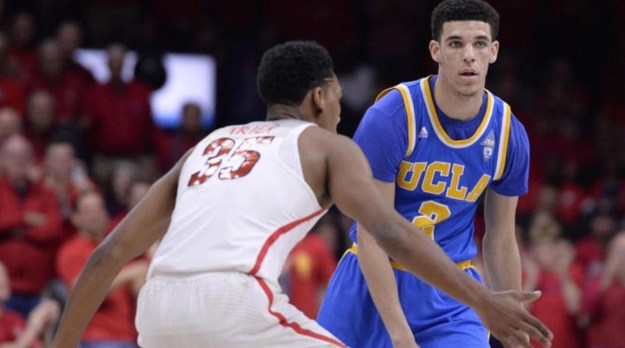
The freshman is already a shot-selection savant. (USA Today)
Pac-12                    W-L   Pace    PPP   Opp. PPP    EM
1.  Oregon               15-2   67.7    1.18    0.98    +0.20
2.  UCLA                 13-3   73.0    1.21    1.05    +0.16
3.  Arizona              15-2   66.6    1.15    1.01    +0.14
4.  Utah                  9-7   69.0    1.11    1.02    +0.09
5.  Cal                  10-6   65.1    1.04    0.98    +0.06
6.  Colorado             6-10   68.8    1.09    1.10    -0.01
7.  USC                   8-8   70.6    1.06    1.09    -0.03
8.  Stanford             6-10   70.2    1.00    1.04    -0.04
9.  Arizona State        7-10   71.2    1.08    1.15    -0.07
10. Washington State     6-10   67.8    1.02    1.15    -0.13
11. Washington           2-14   70.6    1.00    1.14    -0.14
12. Oregon State         1-16   65.8    0.92    1.16    -0.24

AVG.                            68.9    1.07
Acceleration since 2015:        5.2%
KenPom rank: 6
% of games played: 91
To this point in the season Lonzo Ball has attempted just 22 two-point jumpers, per Jeff Haley. That’s well under one per game, and it may explain how a point guard is shooting a higher percentage on his twos (71.8) than what’s being recorded by the likes of Przemek Karnowski, Justin Patton, Lauri Markkanen, John Collins, Josh Jackson, or, perhaps most impressively of all, T.J. Leaf.
It will hardly come as a news flash to learn that as a team UCLA is insanely accurate from the field, and, in fact, the Bruins continue to rank No. 1 in Division I in terms of whole-season numbers. That being said, there is perhaps a 50-50 chance that, incredibly, Steve Alford’s guys won’t even finish No. 1 in their own league in that category during conference play….
Photo finish
Effective field goal percentage
Pac-12 games only
          eFG%      Remaining game(s)
UCLA      58.5      vs Washington and Washington State
Oregon    58.4      at Oregon State
Utah      57.0      vs Cal and Stanford
Numbers as ridiculously high as these over the course of 16 or 17 major-conference games testify to both accuracy and consistently savvy shot selection. Ball not only typifies this kind of wisdom at high velocity, he may even further it. If you watched the Bruins win at Arizona on Saturday night, you noticed how little east-west motion the ball exhibits when Ball’s on the floor. No false motion here.
When the UCLA offense is firing on all cylinders (which, plainly, is most of the time), each pass or dribble sequence gets the ball closer to the goal — unless of course it’s a kick out for still another three by Bryce Alford, Isaac Hamilton or Aaron Holiday. That doesn’t preclude an occasional two-point jumper (see below), but the Bruins give us one of those happy hoops parables where eyes and stats for once cease their bickering and are instead in serene accord.
If Ball’s driving toward the basket it will most often result in a shot attempt for him at the rim or in a pass that will customarily become an assist within a second or two. There are but few exceptions, and it will be a pleasure to watch the freshman continue to dissect defenses for the next few dozen days only.
One of Ball’s teammates may have something to tell us about hoops metaphysics. During Saturday night’s telecast of UCLA’s win at Arizona, my colleague Jay Bilas praised Thomas Welsh as an outstanding midrange shooter. Indeed he is: Welsh is making 52 percent of his two-point jumpers as a sophomore, a number that’s an incredible 15 percentage points higher than the D-I average. Then again Welsh is also making 58 percent of his twos overall, suggesting that such jumpers may be something of a sunk efficiency cost even when your team has the shot-type’s Ted Williams figure.
—
Game of the Year of the week, tonight in Lexington

Markus Howard and Frank Mason III make a higher percentage of their threes than Vanderbilt’s Riley LaChance. Not too many other players can say that. (News Sentinel)
SEC                       W-L   Pace    PPP   Opp. PPP    EM
1.  Florida              13-3   71.3    1.10    0.93    +0.17
2.  Kentucky             14-2   74.0    1.14    0.98    +0.16
3.  South Carolina       11-5   71.0    1.01    0.94    +0.07
4.  Vanderbilt            9-7   66.7    1.08    1.03    +0.05
5.  Arkansas             11-5   70.7    1.13    1.08    +0.05
6.  Alabama               9-7   67.6    0.99    0.97    +0.02
7.  Georgia               8-8   69.7    1.02    1.02     0.00
8.  Ole Miss              9-7   74.3    1.03    1.03     0.00
9.  Tennessee             7-9   72.1    1.01    1.03    -0.02
10. Texas A&M             7-9   68.2    1.01    1.04    -0.03
11. Mississippi State    5-11   72.4    0.99    1.05    -0.06
12. Auburn               6-10   75.2    1.06    1.13    -0.07
13. Missouri             2-14   70.4    0.97    1.08    -0.11
14. LSU                  1-15   74.4    1.01    1.20    -0.19

AVG.                            71.3    1.04
Acceleration since 2015:       11.2%
KenPom rank: 5
% of games played: 89
Vanderbilt plays at Kentucky tonight, and if the Commodores came up 20 points short at Missouri there’s little reason to expect them to give the Wildcats a game. Still, even assuming Bryce Drew’s men don’t pull off the stunner, there is good reason to take note of what Vandy’s up to the rest of the way.
For one thing the ‘Dores have somehow played their way onto the bubble despite their 16-13 overall record. Recall that conventional SEC wisdom says South Carolina and Arkansas are in greater and lesser degrees of good shape, respectively, to join UK and Florida in the NCAA tournament. The odds may weigh against one more bid (this league hasn’t sent five teams to the tournament in 15 years), but if there’s a team positioned to do so it’s Vanderbilt.
The Commodores arrive at Rupp Arena having won four straight since the debacle at Mizzou Arena. After allowing Kim Anderson’s Tigers to ring up 72 points in 65 possessions, Vandy has played outstanding defense for 160 minutes. During this win streak opponents have made just 40 percent of their twos, and 7-foot-1 senior Luke Kornet has recorded no fewer than 16 blocks. No, this run hasn’t come against a murderers’ row of opposing offenses (Texas A&M, South Carolina, Tennessee, and Mississippi State), but the larger point is that defense plus excellent outside shooting — courtesy of Riley LaChance, Nolan Cressler, and Matthew Fisher-Davis — has at least made Vanderbilt a plausible tournament-quality team.
Make that a plausible tournament-quality team facing a very large task on the road this evening. The SEC doesn’t offer many feats more impressive than beating Florida by 10 without arguably your best weapon on offense, and that’s what Kentucky just did as De’Aaron Fox watched from the sideline with a bruised right knee. (Granted, the Gators weren’t at full-strength either.) The Wildcats are working on a late-season surge on defense of their own, so this could be a low-scoring affair.
Note additionally that a loss for Vanderbilt would push all of these chips to Saturday’s game in Nashville against Florida. The schedule maker smiled on Drew’s team, giving it two chances to make its tournament case against the SEC’s best.
—
Legends of the Fall
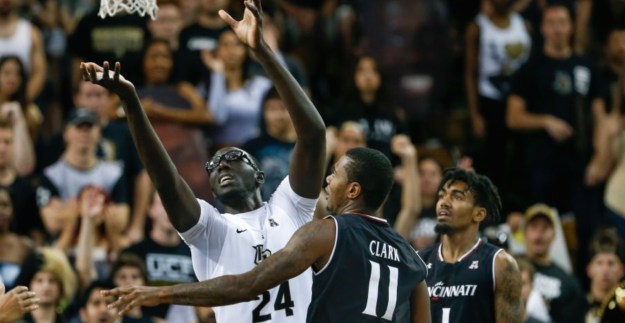
Tacko Fall makes a higher percentage of his twos than Lonzo Ball. Not too many other players can say that. (AP)
American                  W-L   Pace    PPP   Opp. PPP    EM
1.  SMU                  15-1   62.6    1.17    0.93    +0.24
2.  Cincinnati           14-2   64.4    1.09    0.91    +0.18
3.  Houston              11-5   64.8    1.08    1.00    +0.08
4.  Connecticut           9-7   63.4    1.05    1.01    +0.04
5.  UCF                  10-7   66.1    1.00    0.96    +0.04
6.  Memphis               8-8   67.6    0.99    0.97    +0.02
7.  Tulsa                 8-8   66.7    0.99    1.03    -0.04
8.  Temple               6-11   66.7    1.01    1.05    -0.04
9.  East Carolina        5-11   65.4    0.91    1.02    -0.11
10. Tulane               2-14   71.0    0.96    1.10    -0.14
11. South Florida        1-15   68.4    0.91    1.15    -0.24

AVG.                            66.1    1.01
KenPom rank: 7
% of games played: 89
UCF beat Cincinnati 53-49 in Orlando on Sunday. Mick Cronin was displeased with his team (“We were awful offensively“), Tacko Fall helped along the Bearcat coach’s displeasure with four blocks, and Knight fans were jubilant enough to storm the floor after beating what was then the nation’s No. 15-ranked team.
Since we last checked in on Fall’s pursuit of Steve Johnson’s 36-year-old D-I field goal percentage record, the sophomore has been surpassed by UNC Wilmington’s Devontae Cacok. Your leader board now looks like this:
                         2FG%    2FGM/G
S. Johnson      1981     74.6     8.4
D. Cacok        2017     77.5     4.9
T. Fall         2017     74.2     6.7
Strictly speaking Fall’s official field goal percentage is actually 73.8 because he tried (and missed) one three-point attempt this season. As for Cacok some back of the envelope math indicates he’ll need to go 0-for his next seven to fall behind Johnson. Pursuant to any usage requirements you care to set forth, it looks like the Seahawk sophomore has a good shot (har!) at setting a new standard.
Speaking of usage requirements, Markell Lodge is putting up some wild numbers in his own right at Saint Joseph’s….
                         2FG%    2FGM/G
M. Lodge        2017     77.2     2.2
What is it about sophomores?
—
Still looking for the third bid
Jared Terrell and the Rams are still alive, in a manner of speaking. (The Providence Journal)
A-10                      W-L   Pace    PPP   Opp. PPP    EM
1.  Dayton               14-2   69.1    1.09    0.94    +0.15
2.  VCU                  13-3   68.8    1.09    0.95    +0.14
3.  Rhode Island         11-5   68.7    1.07    0.96    +0.11
4.  St. Bonaventure      10-6   69.5    1.05    1.01    +0.04
5.  Richmond             11-5   71.6    1.06    1.02    +0.04
6.  Davidson              7-9   69.3    1.04    1.03    +0.01
7.  George Mason          8-8   69.9    1.06    1.06     0.00
8.  George Washington     8-8   66.5    1.06    1.07    -0.01
9.  La Salle              8-8   68.6    1.05    1.08    -0.03
10. Fordham               7-9   64.9    0.95    1.01    -0.06
11. UMass                4-12   73.4    0.99    1.05    -0.06
12. Saint Joseph's       3-13   69.5    0.97    1.06    -0.09
13. Duquesne             3-13   70.7    1.02    1.12    -0.10
14. Saint Louis          5-11   63.1    0.94    1.10    -0.16

AVG.                            68.8    1.03
KenPom rank: 8
% of games played: 89
Rhode Island did what it had to do to at least keep the conversation going with a win in Kingston against VCU on Saturday. A home win over a (barely) unranked opponent won’t get you into the field by itself, but a loss there probably would have sealed Dan Hurley’s guys into an auto-bid-or-else box. Now at least the Rams have some hope, however faint, of joining Virginia Commonwealth and Dayton in the NCAA tournament.
It won’t be easy. URI closes with what look like highly winnable games at Saint Joseph’s (the Hawks have lost eight in a row) and at home against Davidson. As for the Wildcats, this still sums up their A-10 season fairly well:
A manifestly perimeter-oriented offense that can’t make 3s looks like a water slide in the offseason.https://t.co/XnoUUk0jk8
— John Gasaway (@JohnGasaway) February 9, 2017
(The correct figure for Davidson’s extra-Bronx three-point shooting in A-10 play is now 32 percent.)
If the Rams somehow drop either one of those games, they are likely finished. Then again they may be finished anyway. The uncertainty is hard-wired into the situation when you’re clearly the third-best team in what is perhaps D-I’s eighth-best conference.
—
Fred VanWho?

Landry Shamet wants a ring. (The Wichita Eagle)
Missouri Valley           W-L   Pace    PPP   Opp. PPP    EM
1.  Wichita State        17-1   68.7    1.21    0.92    +0.29
2.  Illinois State       17-1   64.0    1.04    0.90    +0.14
3.  Loyola               8-10   65.4    1.07    1.04    +0.03
4.  Southern Illinois     9-9   65.4    1.01    1.03    -0.02
5.  Missouri State       7-11   65.5    1.03    1.06    -0.03
6.  Northern Iowa         9-9   63.5    0.94    0.99    -0.05
7.  Evansville           6-12   67.0    1.00    1.07    -0.07
8.  Indiana State        5-13   68.9    0.96    1.03    -0.07
9.  Bradley              7-11   67.9    0.96    1.04    -0.08
10. Drake                5-13   70.2    1.01    1.12    -0.11

AVG.                            66.7    1.02
KenPom rank: 10
% of games played: 100
Wichita State finished the Missouri Valley regular season with a downright UCLA-like number for points scored per possession thanks in no small part to 43 percent shooting on its threes. A big part of the credit there goes to Gregg Marshall’s backcourt of redshirt freshman Landry Shamet and junior Conner Frankamp.
In the summer of 2015 Shamet was ranked as the No. 4 prospect in the state of Missouri, behind Jimmy Whitt, Juwan Morgan, and OG Anunoby. He’d no sooner arrived on campus in Wichita than he suffered a stress fracture in his left foot. A medical redshirt followed, and even when the freshman got on the floor last fall he reached Thanksgiving as merely a 31 percent three-point shooter. Now he’s raised that season number to a much more gaudy 46 percent.
Frankamp transferred in from Kansas and made his debut as a Shocker last season. Now a starter for the first time in his career, the junior improved visibly as the season progressed. He shot 51 percent from beyond the arc against the Valley and his career high of 18 points came in one of WSU’s biggest games of the year, the Shockers’ 86-45 dismantling of eventual co-champion Illinois State in Wichita.
Seeing Wichita State tear through the MVC like a buzzsaw is nothing new, however this season Marshall’s men did so with an unusual degree of versatility on offense. Barring a wacky surprise from the committee (and bearing in mind the committee customarily has at least one wacky surprise), opposing coaching staffs in one of four regions will soon be receiving some very frightening game tape.
—
And now a word from a team besides the usual team
Jock Landale’s remarkable year-to-year progression suggests he’ll make 117 percent of his twos as a senior. (AP)
West Coast                W-L   Pace    PPP   Opp. PPP    EM
1.  Gonzaga              17-1   70.5    1.22    0.85    +0.37
2.  Saint Mary's         16-2   59.9    1.17    0.92    +0.25
3.  BYU                  12-6   73.3    1.07    0.98    +0.09
4.  San Francisco        10-8   67.9    0.98    0.96    +0.02
5.  Santa Clara          10-8   62.5    1.03    1.02    +0.01
6.  Loyola Marymount     8-10   68.7    0.97    1.03    -0.06
7.  Pacific              4-14   66.4    0.95    1.08    -0.13
8.  San Diego            6-12   62.7    0.95    1.09    -0.14
9.  Pepperdine           5-13   68.6    0.96    1.17    -0.21
10. Portland             2-16   65.2    0.91    1.12    -0.21

AVG.                            66.6    1.02
KenPom rank: 11
% of games played: 100
Gonzaga’s season-ending 79-71 loss at home to BYU didn’t just allow Scott May, Quinn Buckner and Kent Benson to drink the latest in a series of what has now been 41 annual toasts. It also provides the perfect opportunity to point out that Saint Mary’s has had more or less exactly the season everyone expected when the Gaels were ranked in the preseason top 25.
In fact you can make a case that SMC’s 2017 season is up there on the same bleachers as some of the WCC greats — all of which, to be sure, have come from just two schools….
Best WCC scoring margins, 2010-17
Conference games only
                        EM    And...?
Gonzaga         2017  +0.37      ?
Gonzaga         2013  +0.30   No. 1 seed, round of 32
Saint Mary's    2017  +0.25      ?
Gonzaga         2015  +0.24   No. 2 seed, Elite Eight
Gonzaga         2016  +0.22   No. 11 seed, Sweet 16
Saint Mary's    2013  +0.20   No. 11 seed, round of 32
Saint Mary’s is no Gonzaga statistically, but the one area where the Gaels are superior to the Bulldogs is beyond the arc — both offensively (SMC hit 40 percent of its threes in WCC play) and defensively (conference opponents were allowed to launch just 29.5 percent of their attempts from three-point land). Moreover it’s not entirely clear that, however improbable it may seem in this of all seasons, an SMC player isn’t the most deserving recipient of West Coast POY honors.
The Gael that fits that description is of course Jock Landale. Last year he averaged 15 encouragingly efficient minutes a game off the bench. This season he’s been a fixture on both the offensive and defensive rebounding leaderboards nationally while making 63 percent of his twos and accounting for a larger share of his team’s shots during his minutes than Josh Hart, Caleb Swanigan, Johnathan Motley, Malik Monk, or John Collins can claim within their respective offenses. Landale’s been far more amazing than we expected for a veteran team that’s been every bit as good as we expected.
