
Welcome to this season’s last installment of Tuesday Truths, where I looked at how well 108 teams in nine conferences did against their league opponents on a per-possession basis.
Come back, Zion
This post has nothing to do with Duke or Zion Williamson, Tuesday Truths just really wants to see what the freshman can do at full speed in an NCAA tournament that should be heavily populated by swaggering 2015-style beastly opponents. Hurry back, sir. (USA Today)
Final results, conference games only
Pace: possessions per 40 minutes
PPP: points per possession Opp. PPP: opponent PPP
EM: efficiency margin (PPP – Opp. PPP)
ACC                       W-L   Pace    PPP   Opp. PPP    EM
1.  Virginia             16-2   60.4    1.16    0.93    +0.23
2.  North Carolina       16-2   74.3    1.12    0.97    +0.15
3.  Duke                 14-4   71.9    1.09    0.97    +0.12
4.  Florida State        13-5   67.9    1.04    0.97    +0.07
5.  Louisville           10-8   68.2    1.04    0.97    +0.07
6.  Virginia Tech        12-6   63.3    1.09    1.03    +0.06
7.  Clemson               9-9   66.0    0.99    0.95    +0.04
8.  NC State              9-9   70.7    1.05    1.04    +0.01
9.  Syracuse             10-8   67.3    1.00    1.00     0.00
10. Miami                6-12   67.1    1.01    1.09    -0.08
11. Boston College       5-13   66.9    0.98    1.09    -0.11
12. Notre Dame           3-15   64.8    0.97    1.08    -0.11
13. Pitt                 3-15   66.7    0.95    1.08    -0.13
14. Georgia Tech         6-12   66.3    0.91    1.04    -0.13
15. Wake Forest          4-14   68.5    0.93    1.13    -0.20

AVG.                            67.4    1.02
Clemson is the anti-Indiana. Unlike the wacky and erratic Hoosiers, the Tigers were more or less utterly predictable based on the quality of the opponent.
Indeed, not to put too fine a point on it, Brad Brownell’s group effectively strip-mined the bottom of the ACC for that borderline-Virginia Tech-like scoring margin of theirs….
Tigers vs. the top two-thirds and bottom one-third of the ACC
                                    W-L      EM
Clemson 2019 vs. ACC Nos. 1-10      2-9    -0.08
Clemson 2019 vs. ACC Nos. 11-15     7-0    +0.22
True, the wins at home against the Hokies and Syracuse were indeed nifty. Plus, doesn’t every team, beat up on the bottom of its conference? And, yes, the woke analytic point is that teams that beat the stuffing consistently out of overmatched opponents actually are pretty good.
Still, the Jekyll-and-Hyde performance imbalance here is unusually extreme (Virginia Tech, with a better overall efficiency margin, was “just” +0.15 against the same group of cupcakes). If we’re dishing out scarce bids based in part on some kind of just deserts earned against the strongest opponents on the largest stage, well, can we see what happens at the ACC tournament before rushing to any hasty decisions with these guys?
BONUS “Virginia’s offense is better than its defense” coverage! Right, so, at the risk of sounding repetitive, Virginia’s offense is better than its defense. The season-long numbers here were given a final and rather emphatic push in the direction of the offense when the Cavaliers won a slow-paced (it’s true!) shootout against Louisville.
They think they can just outscore people
Standard deviations better than conference mean
ACC games only
                           Offense (PPP)     Defense (Opp. PPP)
Virginia    2019                1.91                1.49
The most statistically extreme behavior in ACC play this season on either side of the ball was the accuracy with which the Hoos shot threes. Tuesday Truths really believes in this team going into the postseason! What could possibly go wrong?
—
Lubbock is Charlottesville west (and south, kind of)
They took down an entire rim? (texastech.com)
Big 12                    W-L   Pace    PPP   Opp. PPP    EM
1.  Texas Tech           14-4   66.5    1.07    0.93    +0.14
2.  Kansas State         14-4   62.0    1.06    0.96    +0.10
3.  Texas                8-10   62.3    1.09    1.05    +0.04
4.  Iowa State            9-9   67.6    1.08    1.05    +0.03
5.  Kansas               12-6   69.6    1.03    1.00    +0.03
6.  Baylor               10-8   66.1    1.09    1.06    +0.03
7.  TCU                  7-11   68.5    1.02    1.07    -0.05
8.  Oklahoma             7-11   67.3    0.99    1.04    -0.05
9.  Oklahoma State       5-13   64.8    1.00    1.12    -0.12
10. West Virginia        4-14   69.8    0.97    1.11    -0.14

AVG.                            66.4    1.04
Since losing 79-63 at Kansas on February 2, Texas Tech has been a remorseless basketball machine that grinds opponents into dust.
Specifically, the Red Raiders’ signature combination of made threes and punitive defense is feeling very, very Virginia-like.
Chris Beard, Jarrett Culver, Davide Moretti, et al. since February 3
                      W-L   PPP   Opp. PPP    EM     3FG%
Texas Tech            9-0   1.19    0.91    +0.28    42.8
Hide the children.
Kansas says, “Don’t make the mistake we made! Get yourselves some shot volume, quick!” For a team that had the best two-point shooting in Big 12 play, the Jayhawks’ offense was strangely meh, no? (See above: No. 6 in the league.) How does that happen?
A lack of scoring chances didn’t help matters….
Shot volume index (SVI)
Turnover percentage, offensive rebound percentage, and shot volume
Conference games only
Big 12                   TO%     OR%     SVI
1.  Baylor              19.1    38.4     98.3
2.  Texas               16.6    29.2     97.0
3.  Iowa State          15.9    26.6     96.6
4.  Kansas State        17.1    29.3     96.5
5.  Oklahoma State      15.6    24.9     96.2
6.  Texas Tech          17.1    27.0     95.5
7.  Oklahoma            17.2    25.3     94.6
8.  TCU                 20.1    31.1     93.9
9.  West Virginia       22.2    36.1     93.5
10. Kansas              20.1    29.1     93.0
With shot volume being the main performance issue with the team (the D was significantly better than the offense), Tuesday Truths actually isn’t so sure the presence of Udoka Azubuike would have changed things as much as is commonly assumed. Yes, he’s a good offensive rebounder, but KU’s turnover rate says the problem was more with first chances than it was with second chances.
—
The most egalitarian major conference ever
Talk about wide open.
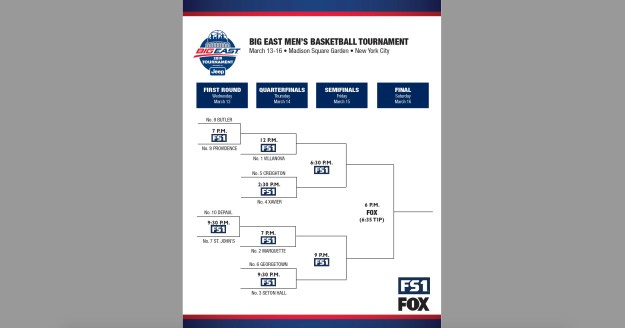
Big East                  W-L   Pace    PPP   Opp. PPP    EM
1.  Villanova            13-5   64.7    1.14    1.04    +0.10
2.  Marquette            12-6   69.4    1.08    1.02    +0.06
3.  Creighton             9-9   68.5    1.07    1.05    +0.02
4.  Seton Hall            9-9   70.3    1.02    1.03    -0.01
5.  Georgetown            9-9   72.0    1.07    1.08    -0.01
6.  Xavier                9-9   65.9    1.06    1.07    -0.01
7.  St. John's           8-10   70.8    1.04    1.07    -0.03
8.  Butler               7-11   68.3    1.04    1.07    -0.03
8.  DePaul               7-11   70.4    1.08    1.11    -0.03
10. Providence           8-10   68.3    0.98    1.02    -0.04

AVG.                            68.8    1.06
Just a brief attaboy to your eyes, for they are not mistaken. The Big East is indeed a perfect Eden of performance homogeneity.
When the league’s tournament gets underway at Madison Square Garden this week, a significant portion of the participants will be fighting for their NCAA tournament lives. That’s what happens when so many teams in the league are clustered in between roughly Nos. 50 and 75 on the NET rankings. You get plenty of .500-ish records in conference play and tons of bubble teams.
The difference between Villanova (+0.10) and Providence (-0.04) is smaller than that between Virginia and Florida State. You can fit the entire 2019 Big East, top to bottom, in a mail slot.
—
A salute to stylistic pluralism on defense
Happ’s actually no Nate Reuvers when it comes to blocking shots, but this is a picture of him blocking a shot. (madison.com)
Big Ten                   W-L   Pace    PPP   Opp. PPP    EM
1.  Michigan State       16-4   66.0    1.13    0.97    +0.16
2.  Purdue               16-4   64.8    1.12    0.99    +0.13
3.  Michigan             15-5   65.0    1.05    0.94    +0.11
4.  Wisconsin            14-6   63.6    1.00    0.93    +0.07
5.  Maryland             13-7   64.8    1.04    0.99    +0.05
6.  Penn State           7-13   67.9    1.00    1.02    -0.02
7.  Iowa                10-10   69.4    1.07    1.09    -0.02
8.  Minnesota            9-11   66.9    1.02    1.05    -0.03
9.  Ohio State           8-12   65.6    0.98    1.03    -0.05
10. Indiana              8-12   65.3    0.99    1.04    -0.05
11. Illinois             7-13   70.3    1.00    1.07    -0.07
12. Rutgers              7-13   67.8    0.99    1.07    -0.08
13. Nebraska             6-14   66.3    1.01    1.09    -0.08
14. Northwestern         4-16   66.1    0.91    1.01    -0.10

AVG.                            66.4    1.02
Congratulations to Wisconsin for catching a Michigan defense that we’ve all, quite rightly, been talking about all season and just barely beating the Wolverines at the finish line. The Badgers, as seen here, can proudly claim that they had the best defense in Big Ten play.
Forcing opponents to miss their twos is usually a good shorthand for a good defense, so one might expect to see Wisconsin and Michigan close together at the top of that leaderboard as well. Instead we see this:
Interior D
Opponent two-point accuracy
Conference games only
                              Opp 2FG%
1. Michigan State               41.9
2. Wisconsin                    42.4
3. Maryland                     44.5
4. Michigan                     46.0
Tuesday Truths has already investigated the high-opponent-shot-volume ways of Michigan State at some length in past years. It’s what the Spartans do, and, in a turnover-neutral Big Ten world, MSU and UM are identical on defense (both allowing 1.14 points per effective possession).
Conversely, when you watch the Wolverines in the field of 68, focus on two things that are more difficult to capture and appreciate in real time than interior defense. First, John Beilein’s and Luke Yaklich’s guys are simply sublime at shutting down opponents on the perimeter. It was all the rage to talk about with this team in last year’s tournament right up until the Villanova incident, and it’s been true again this season.
Perimeter D
Share of opponent FGAs recorded beyond the arc
Conference games only
                           Opp 3FGA/FGA(%)
1. Michigan                     29.4
2. Northwestern                 32.4
3. Penn State                   33.2
4. Wisconsin                    33.9
Second, Michigan, of course, never fouls. This UM defense is tailor-made to shut down an opposing volume scorer that mixes threes and drives to the rim. Be warned.
—
Ducks amok
(goducks.com)
Pac-12                    W-L   Pace    PPP   Opp. PPP    EM
1.  Washington           15-3   66.1    1.05    0.94    +0.11
2.  Oregon               10-8   66.2    1.03    0.98    +0.05
3.  Colorado             10-8   67.9    1.06    1.01    +0.05
4.  Arizona State        12-6   71.4    1.06    1.02    +0.04
5.  Utah                 11-7   69.2    1.12    1.09    +0.03
6.  Oregon State         10-8   67.0    1.09    1.07    +0.02
7.  USC                  8-10   68.7    1.06    1.05    +0.01
8.  Stanford             8-10   70.9    1.02    1.01    +0.01
9.  UCLA                  9-9   73.7    1.06    1.08    -0.02
10. Arizona              8-10   67.1    1.01    1.04    -0.03
11. Washington State     4-14   70.2    1.01    1.14    -0.13
12. Cal                  3-15   69.2    0.95    1.11    -0.16

AVG.                            68.9    1.04
File this under 20-20 hindsight after the team in question won on the road against the league champion in the last game of the regular season, but Oregon’s been playing really well of late without anyone much noticing.
Specifically, the UO defense has been outrageously good in a tiny sample size.
(Long delayed but very effective) quack attack
Ducks since February 27
                  W-L   PPP   Opp. PPP    EM
Oregon            4-0   1.06    0.78    +0.28
To be sure, there’s some good fortune gifted from the hoops gods behind these extreme numbers. Opponents have gone 20-of-86 on their threes during this stretch. Even so, could this Oregon team be in play for a late surge to an at-large?
Keep in mind the staff here at Tuesday Truths maintains a strict “church and state” wall of separation between ourselves and our highly-trained Bubble Watch colleagues. That said, the Ducks still have (a lot of) work to do.
In addition to the victory in Seattle, Dana Altman’s team also owns a neutral-floor win over Syracuse. That’s good. What’s bad is the 5-9 record against Quads 1 and 2 and, yes, the loss at home to Texas Southern. (Though, to be fair, no one’s vetoing Baylor for committing the same transgression). Keep going, Oregon.
—
A spatial theory of Tennessee
(utsports.com)
SEC                       W-L   Pace    PPP   Opp. PPP    EM
1.  Tennessee            15-3   68.0    1.16    0.99    +0.17
2.  Kentucky             15-3   65.8    1.11    0.95    +0.16
3.  LSU                  16-2   70.2    1.13    1.03    +0.10
4.  Auburn               11-7   69.1    1.11    1.03    +0.08
5.  Mississippi State    10-8   68.5    1.08    1.05    +0.03
6.  Florida               9-9   64.1    1.03    1.02    +0.01
7.  Ole Miss             10-8   69.1    1.06    1.05    +0.01
8.  South Carolina       11-7   70.5    1.02    1.04    -0.02
9.  Arkansas             8-10   70.7    1.03    1.05    -0.02
10. Alabama              8-10   69.7    1.01    1.03    -0.02
11. Missouri             5-13   66.0    0.98    1.06    -0.08
12. Texas A&M            6-12   68.5    1.00    1.08    -0.08
13. Georgia              2-16   67.2    0.96    1.12    -0.16
14. Vanderbilt           0-18   65.9    0.90    1.10    -0.20

AVG.                            68.1    1.04
Analytics, schmanalytics! Bah!

Let’s not overthink this. If you see the Volunteers or their opponents attempting two-point shots, that’s good news for Rick Barnes.
Inside the arc
Tennessee vs. opponents
SEC games only
                   Tennessee   Opponents   Margin
Points                814         540       +274
On the other hand, if you see the Volunteers or their opponents attempting three-point shots, that’s bad news for Barnes.
Beyond the arc
Tennessee vs. opponents
SEC games only
                   Tennessee   Opponents   Margin
Points                372         453        -81
Watch the Vols in the field of 68 accordingly.
BONUS “What the heck just happened?” coverage. If it is asked how LSU won the SEC outright in a year when Tennessee is historically great by Tennessee standards and Kentucky is characteristically great by Kentucky standards, the on-court (repeat, on-court) answer is two-fold. Reasonable observers can differ, but for Tuesday Truths here was the order of importance for the two key factors:
1. Shot volume
2. Close-game voodoo
That’s pretty much all of it.
—
Kelvin Sampson is being fitted for a Beilein-style wizard hat
American                  W-L   Pace    PPP   Opp. PPP    EM
1.  Houston              16-2   67.6    1.15    0.95    +0.20
2.  UCF                  13-5   66.5    1.06    0.97    +0.09
3.  Cincinnati           14-4   64.9    1.06    0.99    +0.07
4.  Memphis              11-7   74.8    1.05    1.00    +0.05
5.  Temple               13-5   70.3    1.06    1.01    +0.05
6.  Wichita State        10-8   68.4    1.03    1.01    +0.02
7.  South Florida         8-9   68.0    0.99    0.98    +0.01
8.  Connecticut          5-12   66.9    1.02    1.04    -0.02
9.  Tulsa                8-10   70.4    1.00    1.03    -0.03
10. SMU                  5-12   66.1    1.04    1.09    -0.05
11. Tulane               0-18   72.1    0.92    1.11    -0.19
12. East Carolina        3-14   68.7    0.93    1.13    -0.20

AVG.                            68.7    1.03
Your periodic reminder that the Cougars were picked third in the American preseason coaches’ poll.
—
Eric Musselman knows havoc
Mountain West             W-L   Pace    PPP   Opp. PPP    EM
1.  Nevada               15-3   72.0    1.12    0.92    +0.20
2.  Utah State           15-3   67.5    1.13    1.00    +0.13
3.  Fresno State         13-5   68.7    1.09    0.99    +0.10
4.  Boise State          7-11   66.3    1.09    1.03    +0.06
5.  San Diego State      11-7   68.5    1.02    0.97    +0.05
6.  Colorado State       7-11   68.9    1.09    1.07    +0.02
7.  UNLV                 11-7   68.2    1.08    1.07    +0.01
8.  New Mexico           7-11   72.6    1.02    1.03    -0.01
9.  Air Force            8-10   67.5    1.00    1.07    -0.07
10. Wyoming              4-14   67.6    0.91    1.09    -0.18
11. San Jose State       1-17   71.1    0.89    1.18    -0.29

AVG.                            68.9    1.04
In the traditionally low-turnover Mountain West, Nevada has reaped a nice return on forcing opponents to cough the ball up on one in every five possessions. That and a conga line of Wolf Pack players heading to the line constituted much of the special sauce in Reno this season.
—
Few is still Few
West Coast                W-L   Pace    PPP   Opp. PPP    EM
1.  Gonzaga              16-0   68.6    1.26    0.86    +0.40
2.  Saint Mary's         11-5   63.0    1.10    1.01    +0.09
3.  BYU                  11-5   68.4    1.09    1.06    +0.03
4.  San Francisco         9-7   66.8    1.10    1.08    +0.02
5.  Pepperdine           6-10   68.5    1.05    1.07    -0.02
6.  Loyola Marymount      8-8   63.7    1.01    1.03    -0.02
7.  San Diego             7-9   67.6    1.00    1.04    -0.04
8.  Santa Clara           8-8   66.1    0.97    1.06    -0.09
9.  Pacific              4-12   64.2    0.93    1.06    -0.13
10. Portland             0-16   66.2    0.89    1.12    -0.23

AVG.                            66.3    1.04
To repeat some points made previously, the non-Gonzaga WCC is statistically stronger than the entire Nevada- and Utah State-equipped Mountain West. So, yeah, outscoring this group by 0.40 points per possession fairly screams Minneapolis. Wacky events can always intrude and often do, but the prior essentials are pretty amazing.
