
Welcome to this season’s penultimate installment of Tuesday Truths, where I look at how well 75 teams in six conferences are doing against their league opponents on a per-possession basis.
I don’t think Virginia gets enough credit for its defense
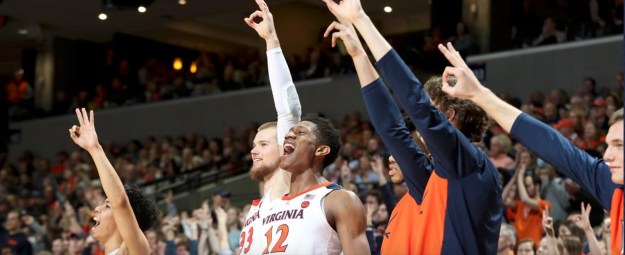
(virginiasports.com)
Through March 4, conference games only
Pace: possessions per 40 minutes
PPP: points per possession Opp. PPP: opponent PPP
EM: efficiency margin (PPP – Opp. PPP)
ACC                       W-L   Pace    PPP   Opp. PPP    EM
1.  Virginia             15-2   60.4    1.16    0.92    +0.24
2.  North Carolina       14-2   74.2    1.13    0.98    +0.15
3.  Duke                 13-3   71.4    1.11    0.97    +0.14
4.  Louisville           10-7   68.6    1.04    0.96    +0.08
5.  Florida State        11-5   68.6    1.04    0.97    +0.07
6.  Virginia Tech        11-5   63.3    1.09    1.03    +0.06
7.  Clemson               7-9   66.1    0.98    0.95    +0.03
8.  Syracuse             10-7   67.3    1.02    1.01    +0.01
9.  NC State              8-8   71.1    1.05    1.07    -0.02
10. Miami                4-12   67.2    1.00    1.08    -0.08
11. Boston College       5-11   66.4    1.00    1.09    -0.09
12. Notre Dame           3-13   65.2    0.97    1.09    -0.12
13. Georgia Tech         5-12   66.3    0.91    1.04    -0.13
14. Pitt                 2-14   67.2    0.95    1.09    -0.14
15. Wake Forest          4-12   68.3    0.93    1.15    -0.22

AVG.                            67.4    1.03
Perhaps this falls under the heading of a blinding flash of the obvious the day after a team sinks 18 shots from beyond the arc (in a game with 59 possessions, if this had been a North Carolina tempo, madre de Dios), but it is of course long past time to retire the “I don’t think Virginia gets enough credit for its offense” announcer trope.
Actually, at the moment, said offense is (very slightly) better than the D relative to the respective ACC means.
They think they can just outscore people
Standard deviations better than conference mean
ACC games only
                           Offense (PPP)     Defense (Opp. PPP)
Virginia    2019                1.78                1.61
The Cavaliers have adopted an interior-oriented look for ACC play in 2019 (North Carolina and Duke both devote a larger share of their attempts to threes than do the Hoos) but, when the three-headed monster of Guy Jerome Hunter (good name for airport bookstalls, that) does try one from deep, it’s been falling. Unless of course it doesn’t, in which case Virginia still wins. (Ask Louisville.)
—
Kansas State is excellent, so let’s discuss what that means for KU
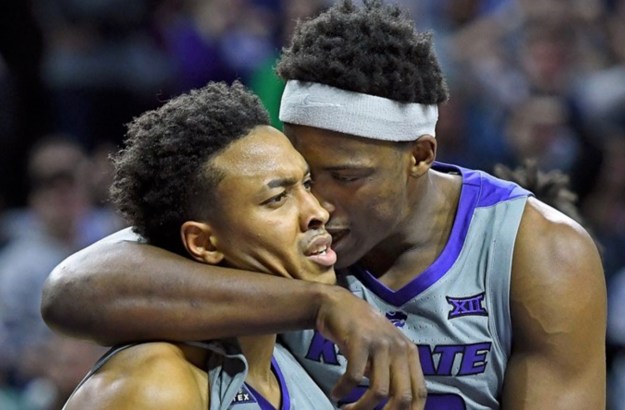
(Scott D. Weaver/K-State Athletics)
Big 12                    W-L   Pace    PPP   Opp. PPP    EM
1.  Texas Tech           13-4   66.2    1.07    0.93    +0.14
2.  Kansas State         13-4   62.0    1.06    0.97    +0.09
3.  Iowa State            9-7   67.0    1.09    1.04    +0.05
4.  Texas                 8-9   62.3    1.10    1.05    +0.05
5.  Baylor               10-6   65.3    1.12    1.07    +0.05
6.  Kansas               11-5   69.1    1.04    1.00    +0.04
7.  Oklahoma             6-10   67.3    0.99    1.05    -0.06
8.  TCU                  6-11   68.8    1.02    1.08    -0.06
9.  Oklahoma State       3-13   64.2    0.99    1.13    -0.14
10. West Virginia        3-13   69.6    0.94    1.10    -0.16

AVG.                            66.2    1.04
I kid, I kid. For once let’s focus our hoops attention a bit further west in the 785 than custom dictates.
Kansas State did not spring out of the gates in Big 12 play like a white-hot grease fire of pure basketball excellence, losing to Texas by 20 and handing Bruce Weber the worst home defeat of his tenure in Manhattan. A subsequent defeat on the road at Texas Tech dropped the Wildcats to 0-2. Dean Wade missed both games, and Kamau Stokes sat out for one of them.
Since that time, however, K-State’s been easily the best Division I team in the Sunflower State….
From Metcalf Avenue to Goodland and from Atchison to Elkhart
Performance since January 6, conference games only
State of Kansas           W-L   Pace    PPP   Opp. PPP    EM
1.  Kansas State         13-2   61.9    1.09    0.96    +0.13
2.  Kansas               10-4   68.4    1.06    1.01    +0.05
3.  Wichita State         8-7   67.7    1.02    1.01    +0.01
All that time people have of course been watching intently and waiting for the No. 2 team in these L. Frank Baum Cup standings to inexorably overtake No. 1. The “overtake” part is now off the mathematical table.
“Pull alongside” is still theoretically possible, as is a forthcoming discussion in March 2033 when old geezers discuss the improbable origins of Kansas State’s incredible streak of consecutive Big 12 titles.
—
DePaul Blue Demons, I salute you!
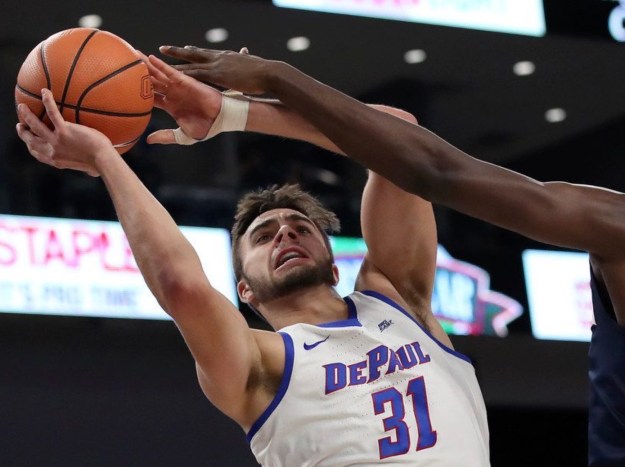
(AP/Jim Young)
Big East                  W-L   Pace    PPP   Opp. PPP    EM
1.  Villanova            13-4   64.8    1.14    1.03    +0.11
2.  Marquette            12-4   69.1    1.09    1.01    +0.08
3.  Georgetown            8-8   71.4    1.07    1.07     0.00
4.  Creighton             7-9   68.3    1.06    1.06     0.00
5.  St. John's            8-9   71.3    1.04    1.05    -0.01
6.  Seton Hall            7-9   70.7    1.01    1.03    -0.02
7.  Butler               6-10   68.2    1.05    1.07    -0.02
8.  Xavier                8-8   65.9    1.05    1.08    -0.03
9.  Providence           6-10   68.3    0.97    1.02    -0.05
10. DePaul               6-10   69.7    1.06    1.12    -0.06

AVG.                            68.8    1.05
The problem with talking about “cannibalism” every time an at-large hopeful loses a conference game to a team at the bottom of the standings is that not all teams at the bottom of the standings are created equal. DePaul is not Wake Forest or Tulane.
In fact, the Blue Demons are perhaps the “best worst” team relative to its conference in recent Tuesday Truths history.
Last place in Truths, 2015-19
Best efficiency margins, conference games only
Cellar                 W-L   Pace    PPP   Opp. PPP    EM
DePaul          2019  6-10   69.7    1.06    1.12    -0.06
Texas           2017  4-14   68.9    0.97    1.06    -0.09
Iowa State      2018  4-14   69.4    1.03    1.13    -0.10
DePaul          2018  4-14   72.7    0.97    1.07    -0.10
Ole Miss        2018  5-13   69.9    1.01    1.11    -0.10
This is not to say DePaul’s the best last-place team, period. Your cellar dweller of choice in the Big Ten likely has that title sewn up this year.
Still, the intra-conference cacophony created by these 10 similarly-performing Big East teams knocking against each other helps explain the selection mess the league’s about to drop in the lap of the men’s basketball committee. It’s hard to make fine distinctions when everyone not named Marquette or Villanova is so egalitarian about things.
—
Purdue is an unstoppable shot-volume monster
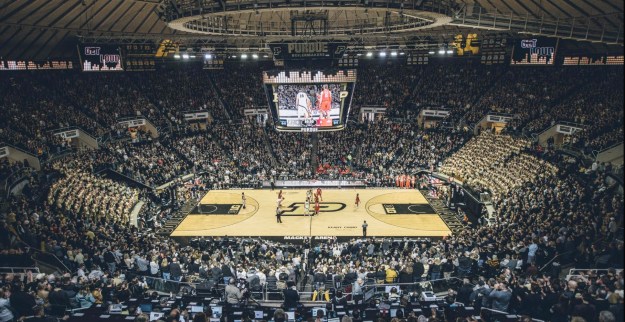
(Purdue Athletics)
Big Ten                   W-L   Pace    PPP   Opp. PPP    EM
1.  Michigan State       14-4   65.9    1.12    0.96    +0.16
2.  Purdue               15-3   64.6    1.13    1.00    +0.13
3.  Michigan             15-4   65.0    1.06    0.93    +0.13
4.  Wisconsin            12-6   63.2    1.01    0.94    +0.07
5.  Maryland             12-7   64.7    1.03    1.00    +0.03
6.  Iowa                 10-8   69.2    1.09    1.10    -0.01
7.  Minnesota            8-10   66.8    1.02    1.05    -0.03
8.  Ohio State           8-10   65.8    0.99    1.02    -0.03
9.  Penn State           5-13   67.8    1.00    1.03    -0.03
10. Illinois             7-11   70.5    1.01    1.05    -0.04
11. Rutgers              7-11   67.6    0.99    1.06    -0.07
12. Indiana              6-12   64.9    0.95    1.03    -0.08
13. Nebraska             5-13   65.9    0.99    1.08    -0.09
14. Northwestern         3-15   66.5    0.91    1.02    -0.11

AVG.                            66.3    1.02
Feast your eyes on Matt Painter’s league-leading offense. The Boilermakers don’t shoot anywhere near as accurately from the floor as does Michigan State, nor do they take care of the ball as well as the usual meticulous suspects like Michigan, Wisconsin, or even Nebraska.
But what Purdue does better than any other Big Ten team is launch shots. Many, many shots.
Shot volume index (SVI)
Turnover percentage, offensive rebound percentage, and shot volume
Major-conference games only
                         TO%     OR%     SVI
1.  LSU                 16.9    37.7    100.7
2.  Purdue              16.0    34.8    100.5
3.  Tennessee           14.8    29.7     99.4
The point is often made that these sassy new-look perimeter-oriented Boilermakers are making West Lafayette into a regular Villanova west, which is true. However, there’s also a little Chapel Hill in the mix. This whole shot-volume thing used to be a North Carolina monopoly, but now a horde of eager would-be Tar Heel epigones have copied the recipe and like what they’re tasting.
—
Utah looks amazing on alternating halves of the court over the course of a game
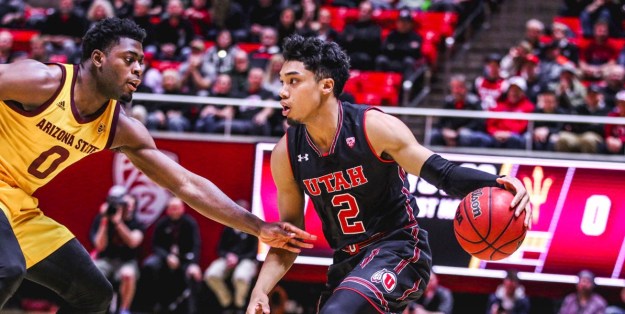
(utahutes.com)
Pac-12                    W-L   Pace    PPP   Opp. PPP    EM
1.  Washington           14-2   66.7    1.06    0.93    +0.13
2.  Oregon                8-8   66.3    1.04    0.99    +0.05
3.  Arizona State        11-6   71.3    1.07    1.03    +0.04
4.  USC                   8-8   68.8    1.07    1.03    +0.04
5.  Colorado              8-8   67.4    1.04    1.02    +0.02
6.  Oregon State          9-7   67.3    1.08    1.06    +0.02
7.  Stanford              8-9   71.0    1.03    1.01    +0.02
8.  Utah                  9-7   69.2    1.10    1.09    +0.01
9.  UCLA                  9-7   73.6    1.07    1.06    +0.01
10. Arizona               8-9   66.7    1.02    1.05    -0.03
11. Washington State     4-12   70.3    1.01    1.14    -0.13
12. Cal                  2-15   69.2    0.95    1.13    -0.18

AVG.                            69.1    1.05
Having your league’s best offense in a major-conference season usually results in a fair degree of notice and adulation, but it doesn’t look like it’s going to pan out that way for Utah in 2019. Who knows, maybe that’s because of a defense that ranks down in the 200s in adjusted efficiency at KenPom.
Duly noted. Still, Larry Krystkowiak knows his way around an offense. The Utes have hopped aboard the Villanova-Purdue perimeter-orientation express train, and that has propelled a team with shall we say intermittent episodes of defensive absence into a surprising degree of laptop respectability.
More perimeter-oriented than thou
Standard deviations higher than conference mean
Major-conference games only, 2019
                              3FGA/FGA
1. Auburn                       2.15
2. Villanova                    2.10
3. Utah                         2.06
With all due respect to Sedrick Barefield, it has perhaps been a Bill Walsh-level tour de force of one-side-of-the-ball coaching. Salute.
—
The golden age of SEC hoops
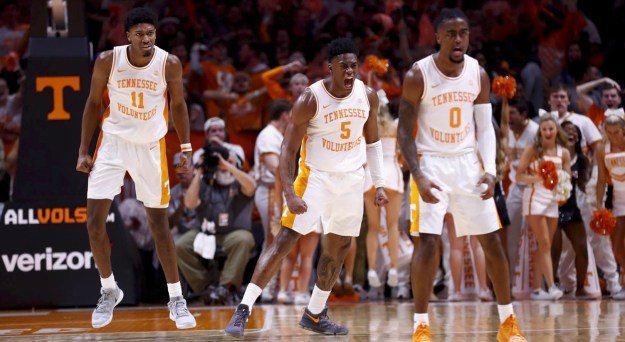
(utsports.com)
SEC                       W-L   Pace    PPP   Opp. PPP    EM
1.  Tennessee            14-2   68.1    1.17    0.99    +0.18
2.  Kentucky             13-3   66.0    1.11    0.94    +0.17
3.  LSU                  14-2   71.2    1.12    1.03    +0.09
4.  Auburn                9-7   69.4    1.10    1.03    +0.07
5.  Mississippi State     9-7   68.4    1.09    1.04    +0.05
6.  Florida               9-7   64.3    1.03    1.01    +0.02
7.  Ole Miss              9-7   69.5    1.05    1.04    +0.01
8.  Alabama               8-8   69.9    1.02    1.02     0.00
9.  South Carolina        9-7   71.3    1.02    1.07    -0.05
10. Texas A&M            6-10   68.8    1.00    1.06    -0.06
11. Arkansas             6-10   71.1    1.01    1.07    -0.06
12. Missouri             4-12   66.6    0.97    1.08    -0.11
13. Georgia              2-14   67.6    1.00    1.14    -0.14
14. Vanderbilt           0-16   66.2    0.91    1.08    -0.17

AVG.                            68.4    1.04
The SEC may — repeat, may — escape bubble drama in 2019. Alabama is pretty dicey comparatively speaking, but, compared to fellow No. 11 seed-type substances like TCU (which has lost six of its last seven) and Minnesota (which has lost six of its last eight), Avery Johnson’s group is a veritable tower of strength.
Even more impressively, the Crimson Tide would, we trust, represent this league’s eighth team in the field of 68. That would make two consecutive years in which the SEC has sent an octet dancing and, how best to put this, nothing anywhere close to that has ever happened with this conference before.
Bids, 1985-2018
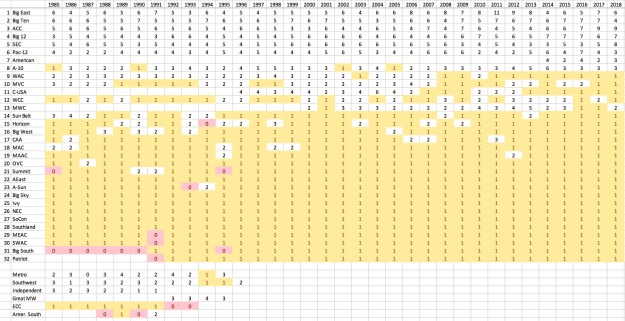
True, the league had some great years back in the day of the Kentucky-Florida duopoly, but 2019’s showing you can have two teams squabbling over an NCAA tournament No. 1 seed and still spread the wealth downward through the top two-thirds or so of the conference. These are the best of times for basketball in the football conference. Salute.
