
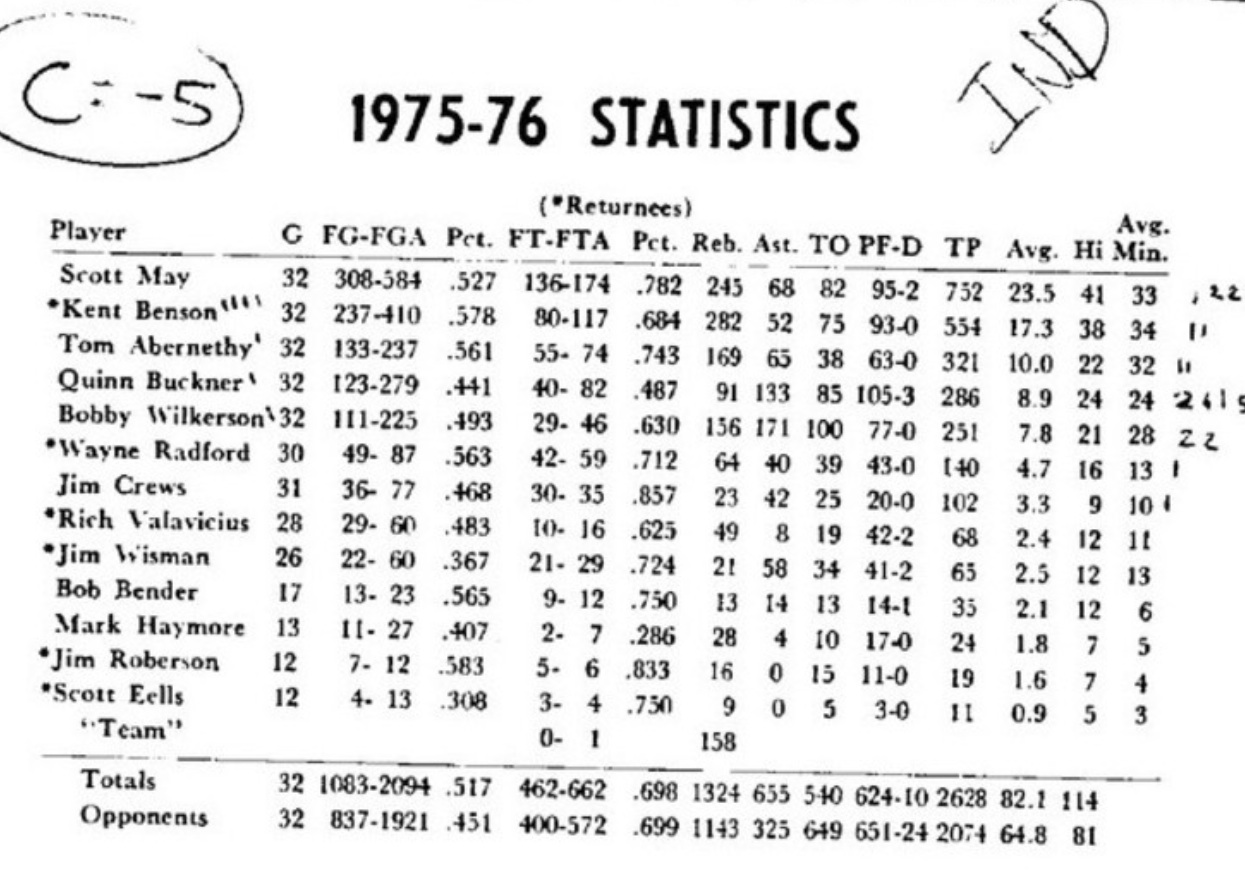
Jahlil Okafor says Kent Benson’s two-point percentage is too low.
Kentucky is trying to do something that hasn’t occurred in 39 years, and assuming UK continues to progress toward that goal (starting with tonight’s road test at Georgia) we will be treated to some good comparisons to that 1976 Indiana team. For instance the Hoosiers that season outscored opponents by 17.3 points a game. As for the Wildcats this season that number is currently 21.8.
That’s not apples-to-apples, of course. We’re viewing IU’s scoring margin after Bob Knight’s men completed a successful trip through the NCAA tournament against some of the best teams in the country. Nevertheless, in early March of 2015 it’s fair to say that John Calipari and his team are giving history a good run for its money. So far.
—
Welcome to Tuesday Truths, where I look at how well 131 teams in the nation’s top 11 conferences are doing against their league opponents on a per-possession basis.
Putting Virginia in historical context
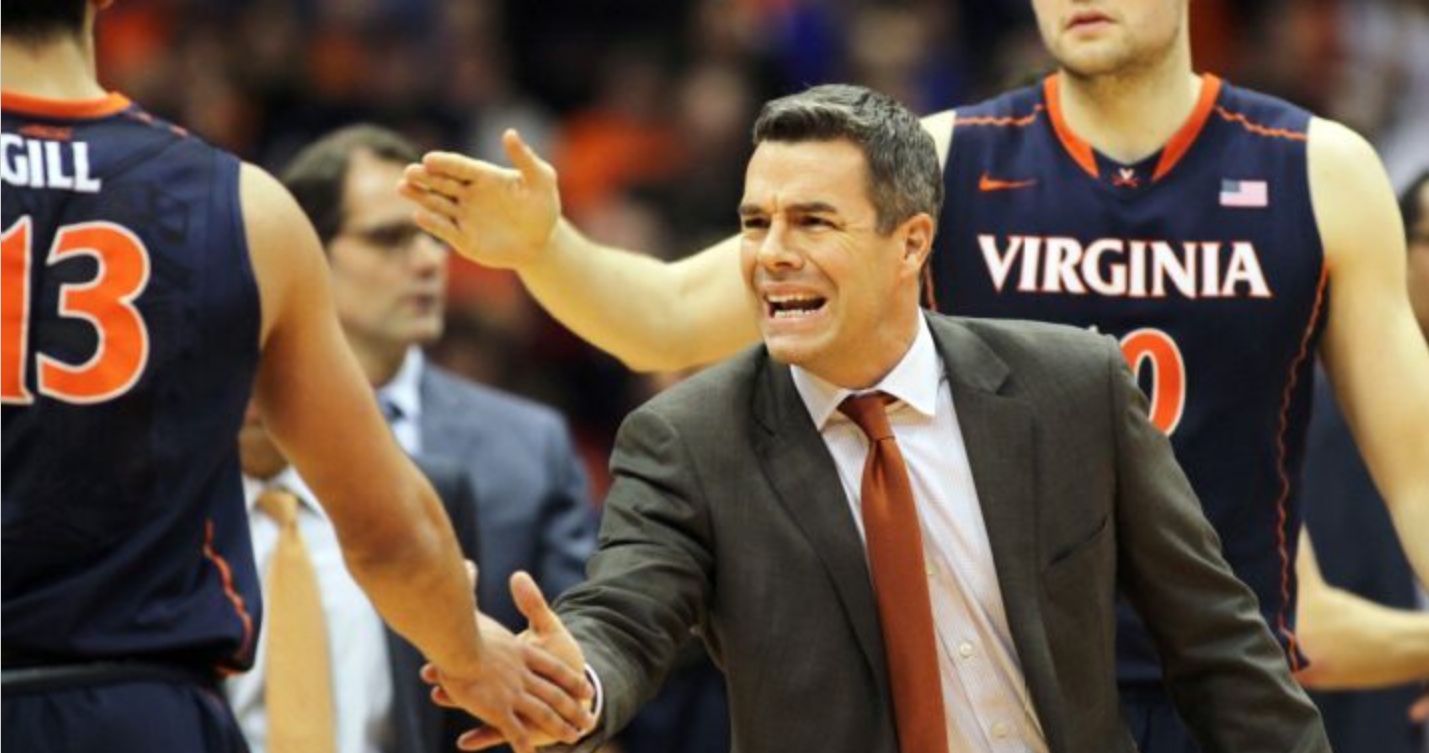
Repeat champions. (AP/Nick Lisi)
Through games of March 2, conference games only
Pace: possessions per 40 minutes
PPP: points per possession Opp. PPP: opponent PPP
EM: efficiency margin (PPP – Opp. PPP)
ACC                       W-L   Pace    PPP   Opp. PPP    EM
1.  Virginia             16-1   57.6    1.07    0.88    +0.19
2.  Duke                 13-3   66.1    1.16    1.04    +0.12
3.  Louisville           11-5   63.7    1.05    0.98    +0.07
4.  North Carolina       10-6   67.6    1.10    1.03    +0.07
5.  Notre Dame           12-4   62.7    1.14    1.08    +0.06
6.  NC State              8-8   63.7    1.07    1.04    +0.03
7.  Miami                 8-8   62.4    1.05    1.03    +0.02
8.  Syracuse              9-8   65.4    1.00    1.02    -0.02
9.  Clemson               8-8   60.8    0.96    0.98    -0.02
10. Pitt                  8-8   60.7    1.09    1.12    -0.03
11. Florida State        7-10   63.6    1.01    1.06    -0.05
12. Georgia Tech         3-14   62.6    0.95    1.01    -0.06
13. Wake Forest          5-11   67.1    1.00    1.09    -0.09
14. Boston College       3-14   61.9    1.01    1.12    -0.11
15. Virginia Tech        2-15   62.4    0.99    1.14    -0.15

AVG.                            63.2    1.04
You may have noticed that Virginia has been pretty good at basketball these last two seasons:
Virginia’s 32-3 in-conference the past 2 seasons. It’s the best 2-year run the ACC’s seen since Duke’s 31-1 in 1999 and 2000.
— John Gasaway (@JohnGasaway) March 3, 2015
Look at it this way: 32-3 certainly bears comparison with the two best seasons registered by the Cavaliers in the Ralph Sampson era (25-3). And speaking in more recent terms, the Hoos have posted two of the better individual seasons achieved by any ACC team in the seven seasons since Messrs. Lawson and Hansbrough won a title for North Carolina.
Best seasons, 2009-15
ACC games only
                                    EM
Virginia                  2014    +0.22
Virginia                  2015    +0.19
Duke                      2010    +0.18
Duke                      2014    +0.16
North Carolina            2012    +0.16
Duke                      2011    +0.16
Duke                      2013    +0.15
North Carolina            2009    +0.15
Miami                     2013    +0.14
Virginia                  2013    +0.11
I wish to note two things about this list. First, Mercer beat a pretty good team. Second, that 2013 UVa team that didn’t even make the NCAA tournament was stronger per-possession than every team put forth by every non-Duke-UNC program in the ACC since 2009 with the single exception of Miami in 2013. I stared at that fact for a few minutes one sunny morning in the 2013-14 preseason and decided that if Tony Bennett was bringing everyone back except Jontel Evans and Paul Jesperson his team was probably going to be pretty good. People thought I was crazy to pick the Hoos to finish as high as second in the ACC that season (fifth was the consensus), and actually my prediction turned out to be way too pessimistic.
The rest is history, and keep in mind this current rotation includes just one senior (Darion Atkins). It’s fair to say the stylistic debate over Virginia (which I personally suspect is largely though not entirely a kiddie pool diversion for casual fans — see the matrix) has blinded us to the historical gorilla in the room. If Duke or UNC were doing this there would be coffee table books. Bennett’s handiwork as yet lacks the imprimatur of third-weekend NCAA tournament success, I get that. Still, factoring in the strength of competition at the top of the conference and the program’s prior history, what’s been achieved in Charlottesville the last two seasons is already somewhat extraordinary.
—
My decade-plus streak of consecutive posts without a pun on Bill Self’s name continues!
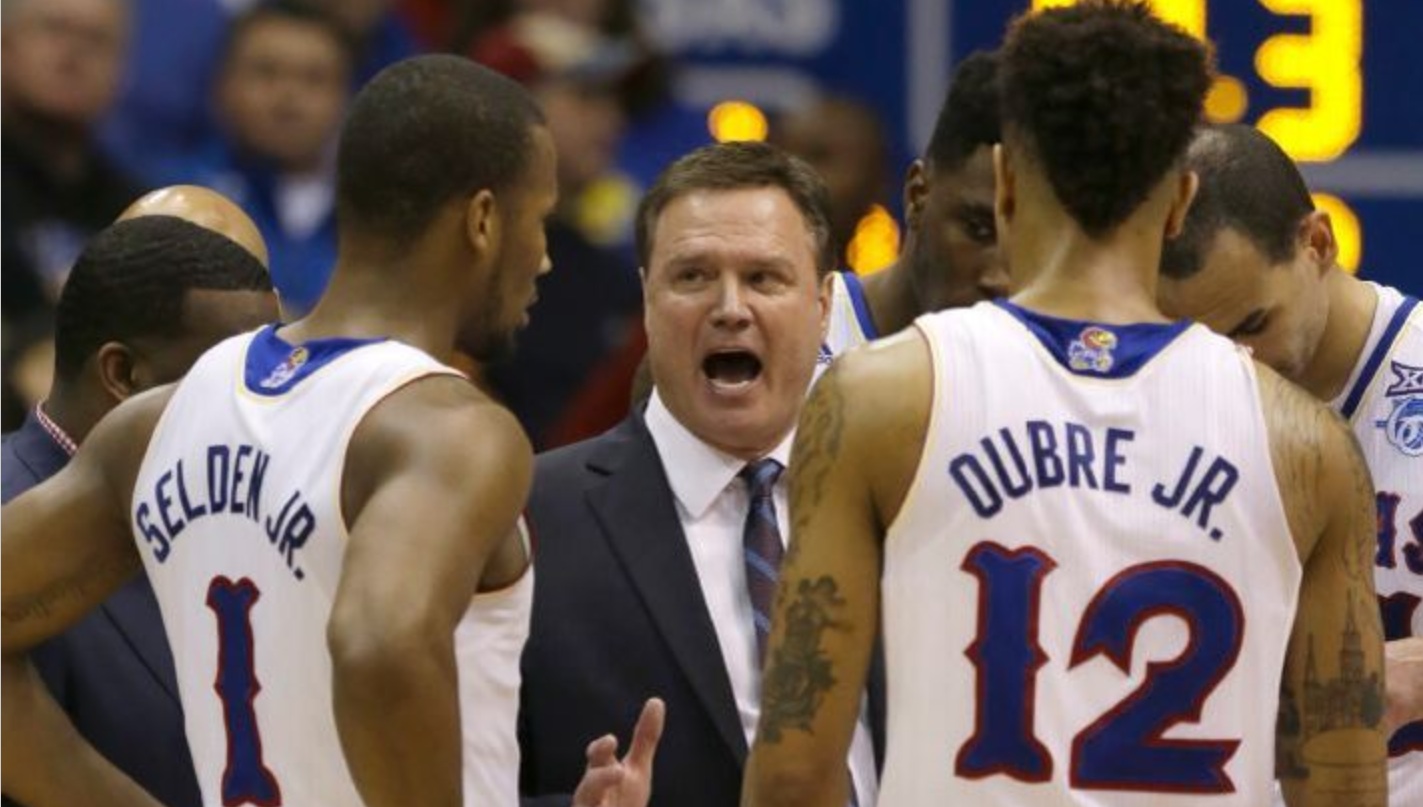
Repeat champions. Repetitively. (AP/Orlin Wagner)
Big 12                    W-L   Pace    PPP   Opp. PPP    EM
1.  Kansas               12-4   66.9    1.08    0.97    +0.11
2.  Oklahoma             11-6   66.7    1.05    0.96    +0.09
3.  Baylor               10-7   61.8    1.08    1.00    +0.08
4.  Iowa State           11-6   69.9    1.10    1.04    +0.06
5.  Texas                7-10   62.8    1.02    1.02     0.00
6.  Oklahoma State        7-9   62.3    0.99    1.00    -0.01
7.  West Virginia        10-6   69.0    1.01    1.02    -0.01
8.  Kansas State          8-9   62.0    0.95    1.02    -0.07
9.  TCU                  4-12   64.9    0.95    1.02    -0.07
10. Texas Tech           3-14   61.6    0.88    1.10    -0.22

AVG.                            64.8    1.01
If we construct a Virginia-style table of the 10 best Big 12 seasons recorded since 2008, Kansas comes out of the exercise looking, oh I don’t know, just a tad dominant….
Best seasons, 2008-15
Big 12 games only
                                    EM
Kansas                    2008    +0.24
Texas                     2011    +0.20
Kansas                    2012    +0.18
Kansas                    2010    +0.18
Kansas                    2011    +0.17
Kansas                    2014    +0.15
Kansas                    2009    +0.15
Kansas                    2013    +0.14
Missouri                  2009    +0.12
Kansas                    2015    +0.11
And that’s just since 2008 — keep in mind the Jayhawks entered that season already having won three consecutive Big 12 titles.
You’ll notice that this year’s KU team barely rates a mention on this list, a point I addressed at Insider on Sunday. This is not your garden-variety great Kansas team. (I will never get used to the idea of a Bill Self team that looks iffy on its defensive glass. It is just too surpassingly strange visually.) But let’s keep any critiques in perspective — every team that Self has had starting with the 2008 national champions is represented on the list above.
Personally I still think Self’s incurring an unneeded opportunity cost by not shooting more threes. Then again I’ve been known to pick nits with the aforementioned ’76 Hoosiers — as well as the ’72 Dolphins and Abraham Lincoln — so take my pro bono counseling for what it’s worth. Unless John Calipari continues to slip Sominex into Gainesville’s drinking water and chooses to stick around Lexington until 2027 for some reason, it’s hard to envision ever seeing a streak like this again. As Self himself has been known to say, the Kansas program is indeed one true champion.
—
Is Villanova the most perimeter-oriented national title contender ever?
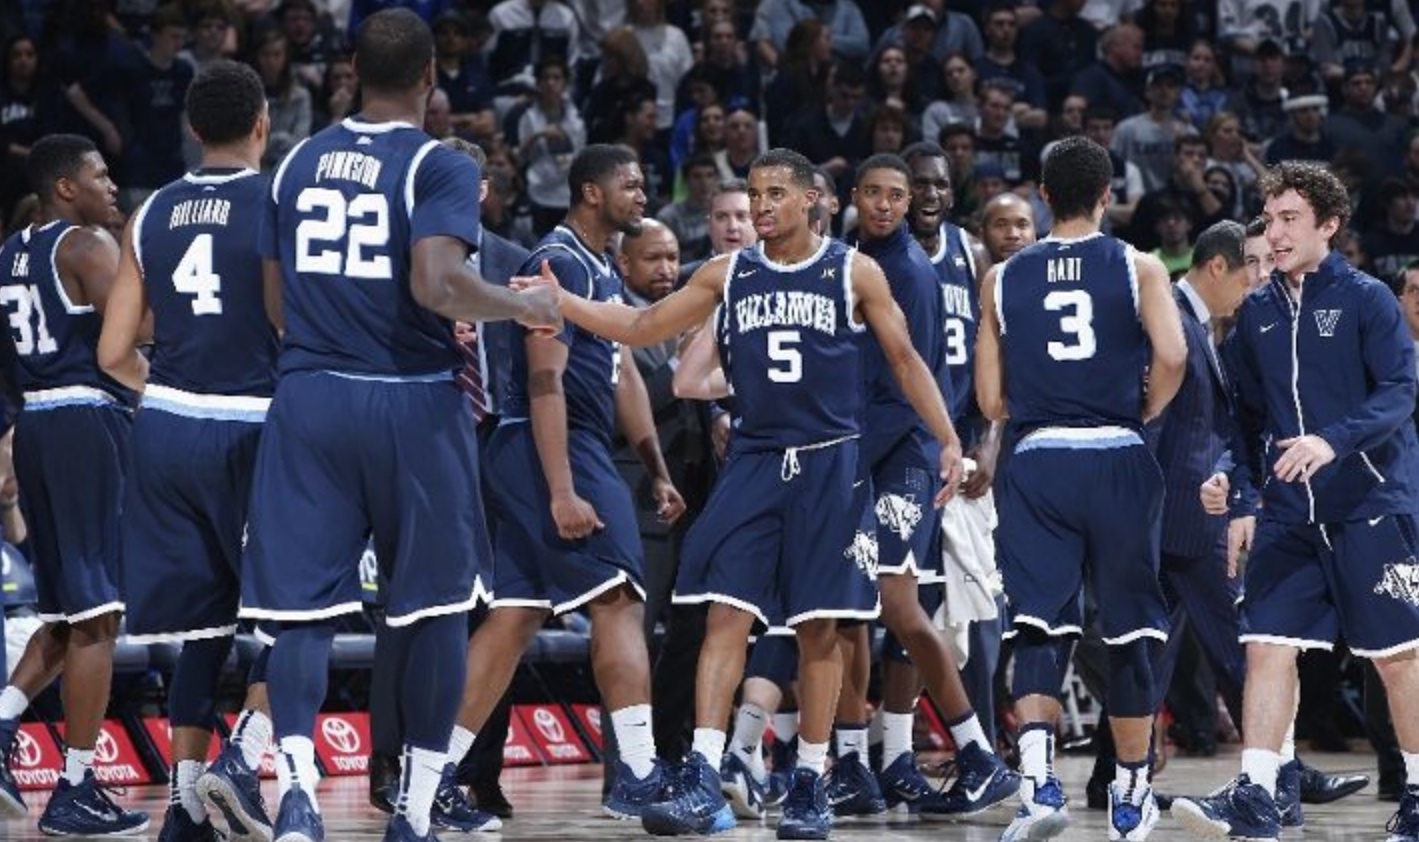
They do like to shoot threes. (Getty/Joe Robbins)
Big East                  W-L   Pace    PPP   Opp. PPP    EM
1.  Villanova            14-2   64.0    1.16    0.98    +0.18
2.  Butler               11-5   63.7    1.08    1.00    +0.08
3.  Georgetown           10-6   64.4    1.06    0.99    +0.07
4.  Xavier                8-9   65.7    1.06    1.03    +0.03
5.  Providence           10-6   65.4    1.05    1.04    +0.01
6.  St. John's            9-7   66.7    1.08    1.08     0.00
7.  Seton Hall           6-10   65.3    1.01    1.09    -0.08
8.  DePaul               6-11   65.1    1.02    1.11    -0.09
9.  Creighton            4-12   62.2    1.00    1.09    -0.09
10. Marquette            3-13   64.4    0.96    1.07    -0.11

AVG.                            64.7    1.05
Last weekend I attended my first ever Sloan Conference, so you’ll have to excuse me if mournful elegies to the gathering’s bygone and more intimate glory days sail over this tyro’s befuddled head. I wasn’t there. It’s like my grandparents talking about the Depression.
One of the best sound bites of the no-longer-intimate or glory-soaked weekend came courtesy of Mike D’Antoni: “No one ever says ‘Live by the post-up, die by the post-up.'” Mike’s point was that if your shots aren’t falling, it doesn’t particularly matter from which location on the floor you’re launching your misses.
Which brings me to Villanova. The Wildcats, like all NCAA tournament teams, will either lose their last game of the season or win the national championship. If it’s the former outcome that occurs, there’s a fair likelihood observers will chalk up the loss to an over-reliance on perimeter scoring. Because, make no mistake, it’s unusual to see a team this good shoot this many threes.
Let’s look at teams seeded on the top two lines over the past six years. (For this year I’ll define that group tentatively as Kentucky, Virginia, Nova, Duke, Arizona, Wisconsin, Kansas, and Gonzaga.)
Perimeter orientation of elite teams, 2010-15
Conference games only
                                3FGA/FGA
                                   (%)
Villanova                 2015    47.5
Villanova                 2014    43.5
Florida                   2014    41.3
Duke                      2012    40.9
Wichita State             2014    39.6
Missouri                  2012    39.4
Wisconsin                 2014    38.6
This might look like a pretty motley crew in terms of tournament outcomes, but keep in mind top seeds haven’t exactly been pulling their expected-win weight in recent years. My point is merely that Villanova this season exhibits an unusual degree of perimeter orientation. Does this put the Wildcats at risk of suffering an off night in the NCAA tournament?
I’m not sure it does, no. In Big East play, Butler and Georgetown have both been more inconsistent statistically in their shooting from the floor than Nova, but no one’s going to bust their stylistic chops (on this front, at least) if the Bulldogs or Hoyas wash out of the tournament early. (For the record Creighton’s been more inconsistent than the Cats on this metric too, but the Bluejays won’t have the opportunity to have their chops busted.) Not to mention this particular perimeter-oriented Villanova team also plays outstanding defense and has an excellent offensive rebounder in the person of Daniel Ochefu. There are fall-backs if the threes don’t fall.
Coach Wright, I hereby give you permission to shoot a ton of threes. Which, granted, is kind of back-fitting on my part, because that’s what you’ve already chosen to do. Carry on.
—
Behold the power of #MoreShots
“My team shoots just as well as Wisconsin, but the Badger offense is exactly one standard deviation better. What the heck is happening here?” (AP/Nam Y. Huh)
Big Ten                   W-L   Pace    PPP   Opp. PPP    EM
1.  Wisconsin            14-2   57.2    1.21    1.02    +0.19
2.  Ohio State           10-6   63.4    1.10    0.99    +0.11
3.  Michigan State       10-6   61.9    1.08    1.00    +0.08
4.  Iowa                 10-6   61.0    1.11    1.04    +0.07
5.  Purdue               11-5   63.6    1.05    0.99    +0.06
6.  Indiana               9-7   64.3    1.13    1.11    +0.02
7.  Maryland             12-4   64.6    1.01    1.00    +0.01
8.  Illinois              8-8   61.8    1.01    1.01     0.00
9.  Minnesota            6-10   64.3    1.03    1.05    -0.02
10. Michigan              7-9   58.6    1.00    1.06    -0.06
11. Penn State           3-13   64.4    0.95    1.01    -0.06
12. Northwestern         5-11   59.2    1.02    1.11    -0.09
13. Nebraska             5-11   61.5    0.93    1.03    -0.10
14. Rutgers              2-14   65.3    0.89    1.08    -0.19

AVG.                            62.2    1.04
This season I’ve attached myself happily to the Wisconsin offense like a remora to a whale to see if I can get a peek into the metaphysics of the sport. Frank Kaminsky and his mates shoot quite well, of course, but you can throw a stick at Tuesday Truths and hit three or four other teams that have been even more accurate from the floor in conference play (cf. Duke, Iowa State, Villanova or Utah). Yet it’s Bo Ryan’s men in particular who are rewriting the record book for offense.
How can this be? Let’s address this question by comparing Wisconsin to the Big Ten’s No. 2 offense, Indiana.
Conference games only
                         eFG%    TO%    OR%   FTA/FGA      PPP
Wisconsin                53.9   11.4   31.7    0.41       1.21
Indiana                  53.6   16.8   33.8    0.29       1.13
The Badgers and IU are close to identical in terms of accuracy from the field. Wisconsin of course has a huge advantage in turnovers and gets to the line far more often, but the Hoosiers are superior on the offensive glass. What’s causing the significant difference in the bottom line — turnovers, free throws, or both?
I vote “turnovers.”
Points per effective (turnover-less) possession: PPeP
Conference games only
                         PPeP
Wisconsin                1.37
Indiana                  1.35
Free throws do help Wisconsin perform slightly better than IU on each effective possession, but roughly 75 percent of the bottom-line real-world difference between these two offenses can be chalked up to turnovers alone.
Getting a shot, whether it’s from the field or the line, on almost 90 percent of your possessions is the offensive equivalent of steroids. And if you can pair your turnover-avoidance with normalcy or better on the offensive boards, look out. It’s the next big thing: #MoreShots. Or should be.
—
The hottest non-Arizona team in the Pac-12 is…Oregon?
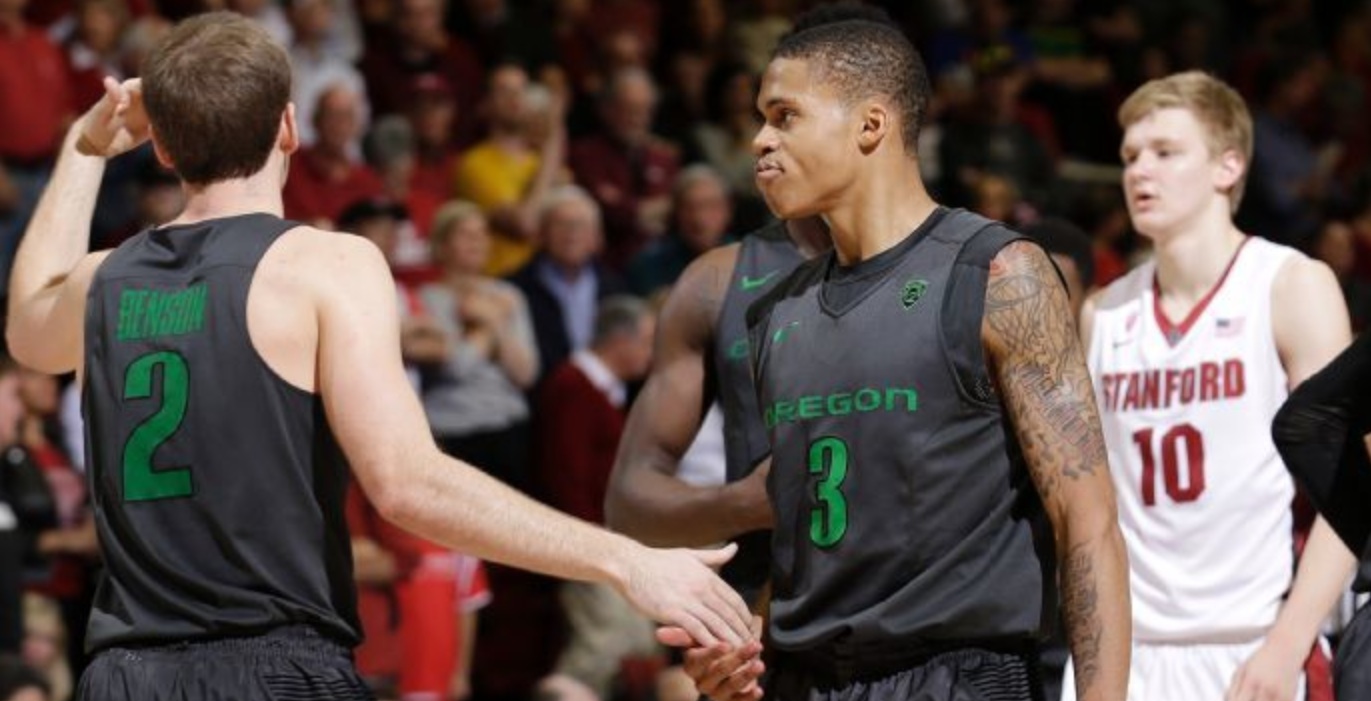
Joseph Young (No. 3) is shooting 90 percent at the line in Pac-12 play. (AP/Jeff Chiu)
Pac-12                    W-L   Pace    PPP   Opp. PPP    EM
1.  Arizona              14-2   65.5    1.14    0.87    +0.27
2.  Utah                 12-4   61.2    1.14    0.90    +0.24
3.  Stanford              9-7   66.1    1.09    1.03    +0.06
4.  UCLA                 10-7   64.0    1.04    1.01    +0.03
5.  Oregon               12-5   66.6    1.10    1.07    +0.03
6.  Arizona State         7-9   65.4    1.01    1.05    -0.04
7.  Colorado             6-10   66.0    0.98    1.05    -0.07
8.  Oregon State          8-9   61.1    0.90    0.97    -0.07
9.  Cal                   7-9   66.6    0.98    1.07    -0.09
10. USC                  3-14   68.8    0.93    1.03    -0.10
11. Washington           4-12   65.8    1.02    1.13    -0.11
12. Washington State     6-10   67.6    1.02    1.14    -0.12

AVG.                            65.4    1.03
(In keeping with this post’s linking device — albeit one that I just completely blew off in the Big Ten section — allow me to note at the top that Arizona is having a Pac-12 season for the ages. I have offered a few thoughts on the Wildcats over the past seven days here and here. Enjoy.)
Oregon this season is being under-discussed due to issues way more important than putting a ball through a hoop. That is as it should be, and by discussing the Ducks I don’t mean to imply that putting a ball through a hoop matters in the larger scheme of things. It doesn’t, so consider this a quick sotto voce observation that I haven’t yet seen elsewhere.
Since UO was blown off the floor by Arizona in Tucson at the end of January, this offense has been outstanding. Over the past nine games and 596 possessions the Ducks have rung up 1.14 points per trip, thanks primarily to production in the paint and near-Wisconsin performance in the area of turnover avoidance.
Joseph Young and Elgin Cook have been gathering despotic momentum on offense as the Pac-12 season has progressed. Cook in particular has been superb in conference play, hitting 55 percent of his twos and shooting 78 percent at the line while drawing six whistles per 40 minutes.
The Ducks are currently being projected as a No. 10 seed, and they’ll arrive at the dance as a relatively anonymous group. Be warned — if UO should cross paths in the round of 32 with a No. 3 seed that’s lugging around a meh defense (Iowa State?) the game could turn out to be more competitive than generally anticipated.
—
Kentucky vs. other great (recent) SEC teams
“Pursuit of perfection” plus “March” equals appointment television. It was true in 2004, 2005, and 2014, and it’s true in 2015. (Getty/Andy Lyons)
SEC                       W-L   Pace    PPP   Opp. PPP    EM
1.  Kentucky             16-0   62.8    1.16    0.89    +0.27
2.  LSU                  10-6   68.9    1.02    0.96    +0.06
3.  Arkansas             12-4   69.4    1.07    1.01    +0.06
4.  Texas A&M            11-5   62.7    1.04    0.98    +0.06
5.  Ole Miss             10-6   66.1    1.08    1.04    +0.04
6.  Georgia              10-6   63.8    1.03    1.00    +0.03
7.  Vanderbilt            7-9   62.7    1.04    1.01    +0.03
8.  Alabama               7-9   60.5    1.02    1.01    +0.01
9.  Florida               7-9   63.2    0.99    0.98    +0.01
10. Tennessee            6-10   60.9    0.98    1.04    -0.06
11. South Carolina       5-11   62.7    0.94    1.03    -0.09
12. Mississippi State    5-11   65.2    0.96    1.05    -0.09
13. Auburn               4-12   68.1    1.00    1.14    -0.14
14. Missouri             2-14   62.6    0.93    1.11    -0.18

AVG.                            64.3    1.02
In per-possession terms Kentucky this season falls comfortably in line with other dominant SEC teams from the recent past. The difference with this current group, of course, is that the 2015-variety Wildcats successfully navigated their way through the non-conference season without losing a game.
Here’s a Virginia- and Kansas-style look at the SEC’s recent history. We’ll start this clock from when Calipari arrived in Lexington….
Best seasons, 2010-15
SEC games only
                                    EM
Florida                   2013    +0.28
Kentucky                  2015    +0.27
Kentucky                  2012    +0.26
Florida                   2014    +0.21
Kentucky                  2010    +0.14
Tennessee                 2014    +0.13
Florida                   2011    +0.12
Kentucky                  2011    +0.12
Missouri                  2013    +0.12
Vanderbilt                2012    +0.11
If you’re scratching your head over a Florida team that in 2013 actually outscored the SEC by as much as what UK’s posting now yet somehow went just 14-4 in conference play, don’t worry. We were all scratching our heads over the Gators that season. (A bit like Texas in 2011.)
Our concern here is more current: Kentucky gets my vote as being just as good as the 2012 national title team. I know Anthony Davis said he and his teammates would “destroy” this year’s edition of UK, but I think “play an incredibly close and entertaining game against” may have been a more apposite phrasing.
The Wildcats’ greatness this season resides in their completeness. I suspect full-strength Virginia’s just as good as these guys on defense, and I’m fairly confident that Wisconsin’s even better than UK on offense. But John Calipari’s guys are in the conversation on both topics. In conference play Kansas has been as good as Kentucky at forcing misses and Duke has been much better at recording makes. But those teams have significant liabilities in other areas.
Which raises a good question — what is UK’s biggest performance liability? Statistically speaking it is the infrequency with which the Cats’ SEC opponents have committed turnovers. Kentucky is merely No. 3 in the conference for opponent turnover percentage. That’s a two-sentence synonym for: Good luck trying to find a performance liability. There is none.
That doesn’t mean Kentucky’s unstoppable, but that plus the fact that the Wildcats haven’t been stopped yet does make these guys the best TV we’ve seen in a very long while.
—
Is UConn really still alive?
American                  W-L   Pace    PPP   Opp. PPP    EM
1.  SMU                  14-3   61.6    1.12    0.95    +0.17
2.  Cincinnati           11-5   59.7    1.04    0.92    +0.12
3.  Tulsa                14-2   62.9    1.02    0.91    +0.11
4.  Temple               11-5   64.3    0.97    0.90    +0.07
5.  Connecticut          10-6   61.3    1.03    0.97    +0.06
6.  Memphis               9-7   64.3    1.02    0.97    +0.05
7.  East Carolina        6-10   59.3    0.99    1.06    -0.07
8.  Tulane               5-11   61.1    0.93    1.03    -0.10
9.  UCF                  5-12   62.8    1.01    1.12    -0.11
10. Houston              2-14   62.6    0.94    1.07    -0.13
11. South Florida        2-14   61.6    0.88    1.08    -0.20

AVG.                            62.0    1.00
Connecticut beat SMU over the weekend, leading to speculation that the Huskies may yet earn a tournament bid. And if I’m understanding the speculators correctly they must be saying UConn is finally looking strong enough to possibly win the American tournament. (Kevin Ollie’s guys are literally off the board on the mock brackets in terms of getting an at-large.)
Said tournament will be played in Hartford, so Connecticut will have every opportunity to win the auto bid. That being said, even at home UConn will need to step up its game. The departure of Shabazz Napier drew the most attention, naturally, but replacing not only Napier but also DeAndre Daniels, Niels Giffey, Laslan Kromah and Tyler Olander has proven to be difficult. Connecticut has taken a step back from last year on both sides of the ball, and bear in mind that 2013-14 team entered the tournament as a No. 7 seed.
The main problem facing Ollie has been that UConn has operated at a turnover deficit relative to its American opponents, one larger than what any other upper-division team has recorded in this league. If the Huskies can erase or at least mitigate that at the American tournament, maybe an auto bid will indeed be in the offing. In that sense the Huskies are still alive — as is every eligible team in Division I except for the programs mathematically out of the running in the Ivy’s 14-game tournament.
—
The Davidson suspense continues
A-10                      W-L   Pace    PPP   Opp. PPP    EM
1.  Dayton               12-4   64.0    1.08    0.95    +0.13
2.  Davidson             12-4   65.0    1.14    1.02    +0.12
3.  Richmond             10-6   62.4    1.06    0.97    +0.09
4.  VCU                  11-5   66.4    1.02    0.93    +0.09
5.  Rhode Island         12-4   65.9    0.98    0.90    +0.08
6.  UMass                10-6   66.3    1.00    1.01    -0.01
7.  La Salle              7-9   64.1    0.94    0.95    -0.01
8.  George Washington     8-8   60.7    1.03    1.04    -0.01
9.  St. Bonaventure       8-8   63.4    1.00    1.03    -0.03
10. Saint Joseph's       6-10   64.1    0.97    1.01    -0.04
11. Fordham              4-12   67.4    0.98    1.05    -0.07
12. George Mason         4-12   63.7    0.99    1.07    -0.08
13. Duquesne             5-11   67.0    1.04    1.14    -0.10
14. Saint Louis          3-13   63.7    0.93    1.08    -0.15

AVG.                            64.6    1.01
VCU and Dayton appear to be safely in the field of 68, but the question of whether or not Davidson will join them in the brackets is looking like it will come right down to the wire. A win at home against the Rams on Thursday night would help the cause, certainly, and Bob McKillop’s men then close the regular season with a road game against Duquesne.
One factor adding to the suspense is the Wildcats’ non-conference schedule. McKillop took two and only two cracks at major-conference competition before A-10 play and came up short against both North Carolina and Virginia. Conversely Shaka Smart and Archie Miller both have a ready supply of brand-name victims to display to the committee.
Purely as a fan I hope Davidson makes it, because the testimony of 1,048 A-10 possessions is telling me that the Wildcats are as good at the sport as rivals who are indeed going to get bids. Still, McKillop knew going into the season how this game is played. Scheduling matters.
—
Never mind the seed, think of Wichita State as “2014 Part II: Wrath of Ron”
Missouri Valley           W-L   Pace    PPP   Opp. PPP    EM
1.  Wichita State        17-1   60.0    1.13    0.88    +0.25
2.  Northern Iowa        16-2   56.3    1.11    0.93    +0.18
3.  Illinois State       11-7   62.1    1.05    0.96    +0.09
4.  Indiana State        11-7   63.9    1.03    1.00    +0.03
5.  Evansville            9-9   63.1    0.98    1.00    -0.02
6.  Loyola               8-10   57.7    1.00    1.05    -0.05
7.  Southern Illinois    4-14   60.7    0.94    1.05    -0.11
8.  Bradley              3-15   60.5    0.91    1.02    -0.11
9.  Drake                6-12   56.8    1.01    1.13    -0.12
10. Missouri State       5-13   59.1    0.91    1.05    -0.14

AVG.                            60.0    1.01
These numbers are now final, and by my lights Wichita State is just as good as if not better than the team that grabbed a No. 1 seed last year.
Wichita State finished better per-conf-possession than when they ran the table in ’14. And the MVC improved. Fill your bracket accordingly.
— John Gasaway (@JohnGasaway) February 28, 2015
Gregg Marshall has hopped aboard this #MoreShots bandwagon (the Shockers gave the ball away on just 14 percent of their possessions in Valley play) and he also borrowed a page from the Mike Krzyzewski playbook and chased opponents off the three-point line with single-minded fervor.
I guess what I’m saying is that Wichita State would be one fearsome No. 4 seed, but in a year when the mocks are showing me teams on the 4-line like Utah, Notre Dame and Louisville, this Mighty 4s thing may turn out to be something of a theme for the 2015 tournament.
—
Boise State’s good even though it did beat San Jose State by 50
Mountain West             W-L   Pace    PPP   Opp. PPP    EM
1.  Boise State          12-4   61.8    1.11    0.95    +0.16
2.  San Diego State      12-4   59.7    1.03    0.89    +0.14
3.  Colorado State       11-5   65.7    1.10    0.98    +0.12
4.  Utah State           11-5   61.8    1.07    0.97    +0.10
5.  UNLV                  7-9   64.0    1.07    1.04    +0.03
6.  Wyoming              10-6   59.2    0.99    1.00    -0.01
7.  Fresno State          9-7   63.6    1.01    1.02    -0.01
8.  New Mexico           6-11   60.2    1.00    1.01    -0.01
9.  Air Force            6-11   60.6    1.03    1.11    -0.08
10. Nevada               5-11   63.0    0.96    1.07    -0.11
11. San Jose State       0-16   63.4    0.80    1.12    -0.32

AVG.                            62.1    1.01
Boise State recorded a huge 56-46 win at San Diego State over the weekend, so I’ll give the Broncos the benefit of the evaluative doubt — even if Leon Rice’s team looks fantastic here in part because they beat up on poor defenseless San Jose State back in January.
The “San Jose State was never born” standings
Mountain West             W-L   Pace    PPP   Opp. PPP    EM
1.  San Diego State      11-4   59.4    1.02    0.89    +0.13
2.  Boise State          11-4   61.4    1.10    0.98    +0.12
3.  Colorado State        9-5   66.2    1.10    1.00    +0.10
4.  Utah State            9-5   61.5    1.07    1.01    +0.06
5.  UNLV                  6-9   63.9    1.07    1.06    +0.01
6.  New Mexico           5-11   60.0    0.99    1.03    -0.04
7.  Wyoming               8-6   59.3    0.96    1.00    -0.04
8.  Fresno State          7-7   63.5    0.98    1.03    -0.05
9.  Air Force            4-11   60.5    1.01    1.14    -0.13
10. Nevada               3-11   62.4    0.96    1.11    -0.15

AVG.                            61.8    1.03
Removing that game from BSU’s resume (and all SJSU games from every team) makes the Broncs look more normal, but any way you slice it Derrick Marks and his teammates have won 12 of their last 13. That’s been good enough to lift Boise State to the 11-line in the mocks. (SDSU and Colorado State are in.) Keep winning, Broncos. Being projected as a No. 11 seed at the beginning of March means there’s still work to be done — even if that whole “bid thief” thing really is a bit overstated.
—
The BYU suspense resurfaces
West Coast                W-L   Pace    PPP   Opp. PPP    EM
1.  Gonzaga              17-1   63.4    1.19    0.95    +0.24
2.  BYU                  13-5   68.6    1.18    1.03    +0.15
3.  Saint Mary's         13-5   61.0    1.10    1.01    +0.09
4.  Pepperdine           10-8   62.4    0.99    0.98    +0.01
5.  San Diego            8-10   62.1    0.98    0.99    -0.01
6.  Portland             7-11   64.8    1.05    1.09    -0.04
7.  San Francisco        7-11   64.0    1.03    1.09    -0.06
8.  Santa Clara          7-11   60.5    0.99    1.11    -0.12
9.  Pacific              4-14   61.0    1.00    1.14    -0.14
10. Loyola Marymount     4-14   61.2    1.00    1.15    -0.15

AVG.                            62.9    1.05
Last week I wrote off Brigham Young as dead and buried, a passage that Dave Rose apparently used as bulletin board material. Fired up with their “Prove Gasaway wrong!” chants the Cougars promptly went out and ended Gonzaga’s 41-game home winning streak. Little things like that tend to help your tournament resume, though at the moment it could still go either way for BYU.
Fine, I see how this works. So let me just say this: Cougars, you have no chance at getting into the tournament. None. You’re finished. Just give up.
(When you cut down the nets in Indy, Coach Rose, remember to thank me.)
