
(newsobserver.com)
It may have been pure chance that the genius who invented the very idea of advanced stats also happened to be: a) the most successful college basketball coach not named “John Wooden” up to his time; and b) one of the finest and most praiseworthy people you would ever wish to encounter. His idea’s sheer power was such that it would have made basketball divulge its secrets even if the man who first conceived of it had been an imperious egoist with a losing record. However the fact that the man was none of those things would prove convenient for me personally on more than one occasion.
Whenever those of us who were following gratefully in these footsteps were told that what we were doing was somehow threatening or peripheral, contrived or irrelevant, abstruse or faddish, the plain truth always sufficed as a response. Always.
Quote-unquote advanced stats would be impossible without the work Dean Smith did more than 50 years ago. He is the founding figure, period.
— John Gasaway (@JohnGasaway) February 8, 2015
Read more about a brilliant man who was doing this stuff when Bill James was still in grade school. And at at the other end of the timeline, the story on the college basketball side from Dean Oliver through 2013 has also been summed up nimbly.
Welcome to Tuesday Truths, where I look at how well 131 teams in the nation’s top 11 conferences are doing against their league opponents on a per-possession basis.
Defense and adulation
Through games of February 9, conference games only
Pace: possessions per 40 minutes
PPP: points per possession Opp. PPP: opponent PPP
EM: efficiency margin (PPP – Opp. PPP)
ACC                       W-L   Pace    PPP   Opp. PPP    EM
1.  Virginia              9-1   57.0    1.09    0.91    +0.18
2.  Duke                  8-3   65.5    1.15    1.05    +0.10
3.  North Carolina        8-3   67.7    1.11    1.03    +0.08
4.  Louisville            7-3   63.6    1.08    1.00    +0.08
5.  Notre Dame            9-3   62.0    1.14    1.09    +0.05
6.  NC State              5-6   65.4    1.08    1.06    +0.02
7.  Miami                 5-5   61.3    1.03    1.03     0.00
8.  Syracuse              6-4   66.6    1.02    1.02     0.00
9.  Clemson               6-5   60.1    0.96    0.98    -0.02
10. Georgia Tech         2-10   62.0    0.99    1.02    -0.03
11. Florida State         5-7   63.2    1.04    1.08    -0.04
12. Pitt                  5-5   61.1    1.08    1.13    -0.05
13. Wake Forest           3-8   68.4    1.01    1.09    -0.08
14. Virginia Tech         2-9   64.5    0.98    1.09    -0.11
15. Boston College        1-9   61.4    0.97    1.12    -0.15

AVG.                            63.3    1.05
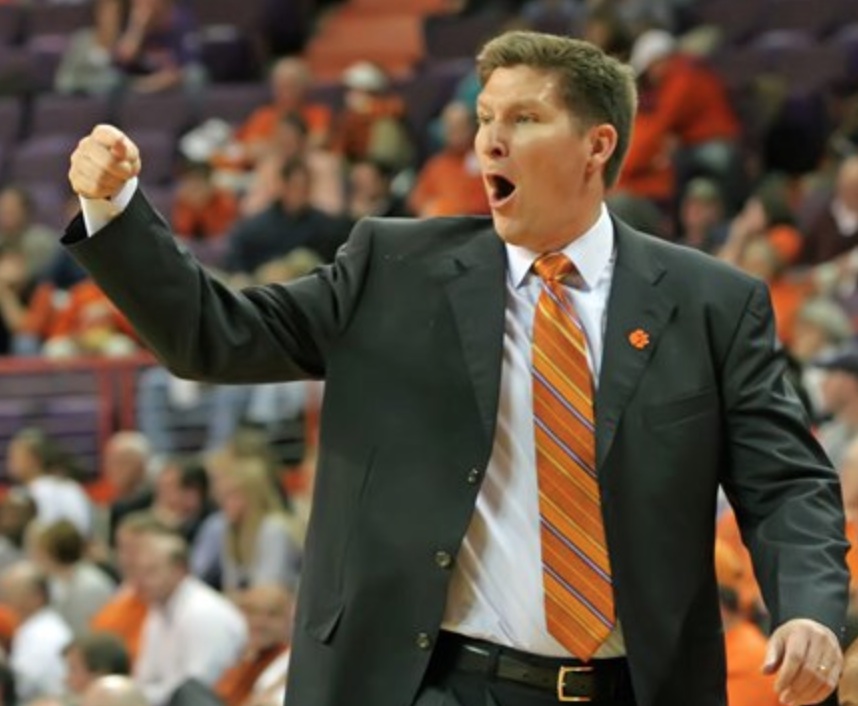
If defending shooters is your thing, this man deserves a cult all his own. (It’s Brad Brownell.) (He’s the coach at Clemson.) (It’s a school in the ACC.)
In recent weeks the hymns sung to the undoubtedly outstanding Virginia defense (see numbers above) have begun to cohere around a few key tropes. I’ve seen an awful lot of diagrams about the pack line defense, my fair share of slow-motion video of players showing good weak-side help on D, and no shortage of clips on doubling the post.
And that’s fine. But if “defense” were merely “forcing a miss on the first shot of the possession” then we’ve been giving our attentions to the wrong ACC team. It turns out we should be breaking down film on Clemson too.
Forcing misses
ACC games only
                       Opponent
                         eFG%
Clemson                  43.6
Virginia                 44.2
Louisville               45.2
Virginia is far better than the Tigers on defense overall because the Cavaliers are far superior on the defensive glass and also much more successful at coaxing turnovers out of opponents. (I demand less talk of 10 eyes on the ball and more praise of Darion Atkins putting two hands on the ball on that latest rebound.) Defense is more than just forcing misses, and the Hoos excel in all facets.
And this is just how much Virginia excels at all defensive facets. Imagine we gave a pill to all UVA opponents that made it impossible for them to commit turnovers. Henceforth every team that plays the Cavaliers puts a zero in the turnover column. There’s a shot attempt — from the field or the line — on every single possession. It turns out that imaginary zero-takeaway Virginia defense would allow 1.11 points per possession in ACC play, meaning it would still be better than the actual Boston College D (1.12). Diabolical and debonair dauphin of diligent defenders Tony Bennett, I salute you!
Bill Self cares not for your paeans to stylistic flexibility
Big 12                    W-L   Pace    PPP   Opp. PPP    EM
1.  Oklahoma              8-4   66.9    1.07    0.94    +0.13
2.  Kansas                8-2   68.2    1.08    0.96    +0.12
3.  Baylor                6-5   63.1    1.07    1.01    +0.06
4.  Iowa State            7-4   70.0    1.11    1.05    +0.06
5.  Oklahoma State        7-5   62.9    0.99    0.96    +0.03
6.  West Virginia         6-4   72.1    0.99    0.98    +0.01
7.  Texas                 4-6   63.6    1.01    1.04    -0.03
8.  Kansas State          5-6   60.3    0.96    1.01    -0.05
9.  TCU                   1-9   65.8    0.92    1.03    -0.11
10. Texas Tech            2-9   63.0    0.85    1.11    -0.26

AVG.                            65.6    1.01
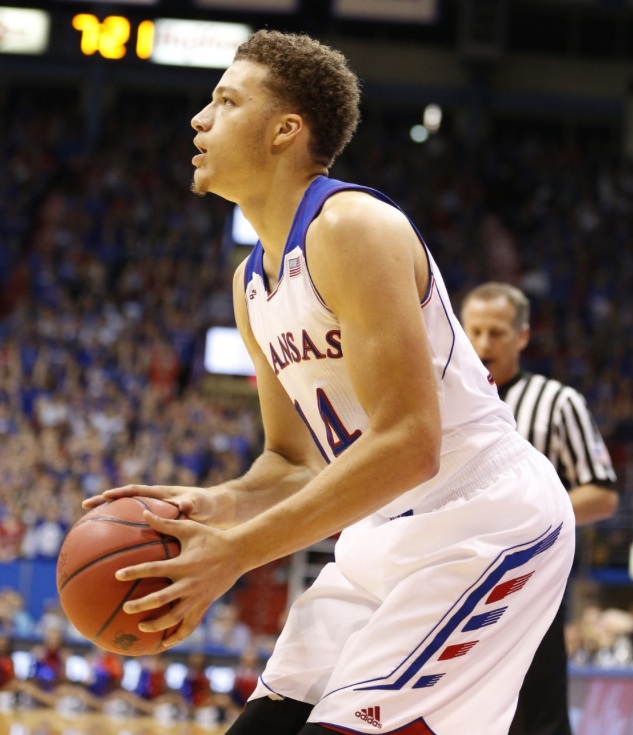
A rare sight.
This season Jesse Newell of the Topeka Capital Journal has posed an interesting question: Why doesn’t Kansas shoot more threes? In Big 12 play the Jayhawks lead the league in three-point accuracy while clocking in at a solid but by no means dazzling No. 3 in terms of success inside the arc. Yet despite those two numbers, Kansas ranks No. 8 in the conference in the share of field goal attempts it launches from beyond the arc. Only Kansas State and TCU are less likely to shoot a three.
Self says this is simply a matter of “game situations.” Well, over the last five years those game situations sure have been remarkably uniform whenever he shows up to coach….
Staying the course
                       3FGA/FGA
                       Variation
Bill Self                1.31
Bob Huggins              1.35
Fran McCaffery           1.56
Leonard Hamilton         1.66
Tad Boyle                1.74

Average                  3.66

Major-conference games only, 2011-15
By my count there are 38 coaches who have been in their present major-conference gigs now for five seasons, and of those guys Self ranks No. 1 in three-point stylistic consistency. (Bob Huggins is so close behind on this measure he might fairly be called 1a, and before the season is out he may overtake Self.) Come what may Kansas will devote 30 percent of its shots to tries from beyond the arc. No more, no less.
Self has won 10 Big 12 titles in a row, so maybe he’s on to something with this shot selection auto-pilot. Or perhaps not fretting about his team’s shot mix frees him up to concentrate on weightier matters. There is also the small fact that KU has a very good offense, currently ranked No. 2 (behind only Iowa State) in the league in terms of points scored per possession.
I’m not saying Self is wrong to shoot so few threes. I am saying that Self quite plainly challenges our habit of praising coaches for being flexible, for changing to meet new conditions, and for adapting to the players they have on hand. In this one instance, at least, Self is the antithesis of all those qualities. And it works for him.
Why Chris Mack should ignore John Gasaway and be exactly like Bill Self
Big East                  W-L   Pace    PPP   Opp. PPP    EM
1.  Villanova             8-2   64.7    1.10    0.95    +0.15
2.  Butler                8-3   65.4    1.08    1.00    +0.08
3.  Georgetown            7-5   63.6    1.04    0.99    +0.05
4.  Xavier                6-6   65.6    1.09    1.06    +0.03
5.  Providence            7-4   64.5    1.05    1.04    +0.01
6.  Seton Hall            5-6   64.4    1.03    1.06    -0.03
7.  St. John's            4-6   65.8    1.07    1.10    -0.03
8.  DePaul                6-6   64.9    1.05    1.09    -0.04
9.  Marquette             3-8   64.3    0.96    1.02    -0.06
10. Creighton            2-10   62.4    0.97    1.11    -0.14

AVG.                            64.6    1.04
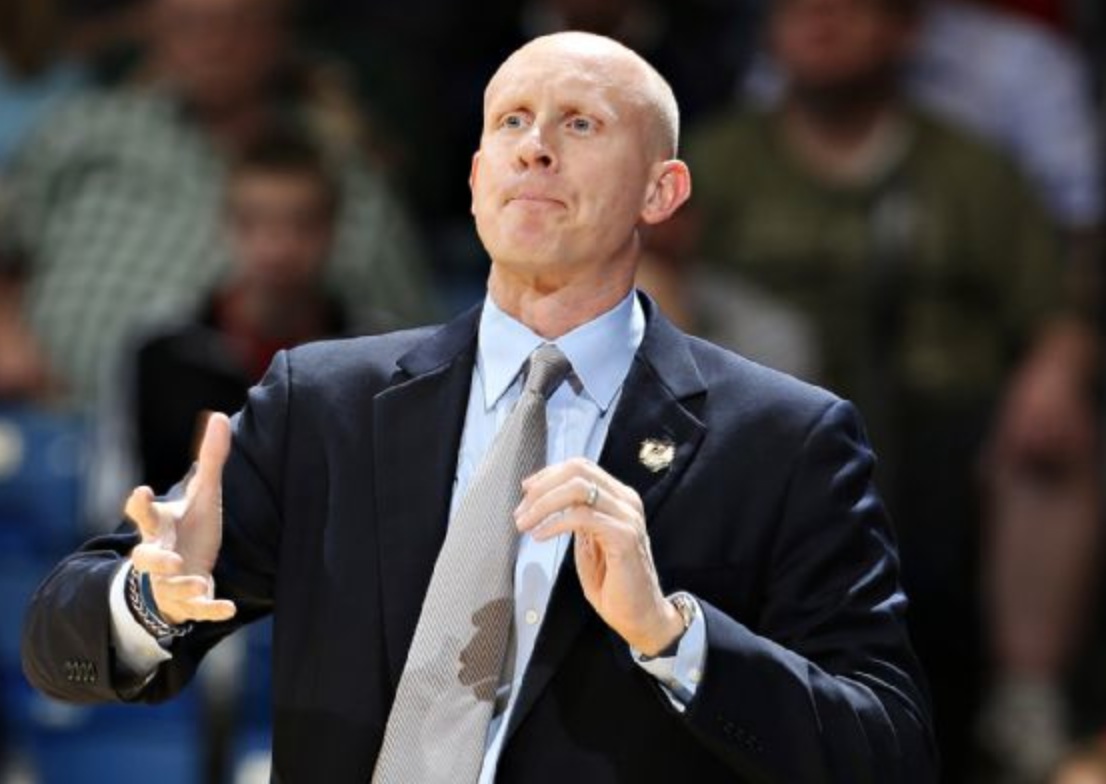
He’s trying to *will* that three into the basket.
The Xavier offense this season has been a study in extremities. On the one hand these guys are incredible where it matters most on offense.
Best 2-point shooting teams
Major-conference games only
                       2FG%
Xavier                 55.8
Wisconsin              55.6
Iowa State             54.7
Ohio State             53.5
Utah                   53.4
Notre Dame             52.6
On the other hand, the Musketeers are utterly helpless from beyond the arc.
Worst 3-point shooting teams
Major-conference games only
                       3FG%
TCU                    27.3
West Virginia          27.3
Rutgers                27.9
Nebraska               28.3
Providence             28.6
Xavier                 28.7
In Big East play Dee Davis, Trevon Bluiett, and J.P. Macura are shooting a combined 21 percent from outside. It’s frankly amazing that this team has managed to score 1.09 points per possession in Big East play.
Chris Mack will want to rush right out and buy his copy of Because There Are No Threes…Wait, What? There Are? Oh, Well, I Don’t Care: The Bill Self Story. The Musketeers shoot more threes than Kansas, and right now that’s an inefficacious allocation of resources. I say buy Matt Stainbrook a Brad Waldow poster and load the big guy up with shots and possessions. (Well, fine, you’ll have to make a Brad Waldow poster. You get my drift.)
Well of course Penn State’s been better than Maryland…wait, what?
Big Ten                   W-L   Pace    PPP   Opp. PPP    EM
1.  Wisconsin             9-1   57.6    1.28    1.05    +0.23
2.  Ohio State            7-4   63.9    1.11    1.00    +0.11
3.  Michigan State        6-4   63.4    1.05    0.97    +0.08
4.  Purdue                7-4   62.9    1.04    1.00    +0.04
5.  Minnesota             4-7   65.0    1.01    1.01    +0.01
6.  Iowa                  6-4   59.7    1.13    1.13     0.00
7.  Penn State            3-8   64.3    0.99    1.00    -0.01
8.  Illinois              6-5   63.1    1.00    1.01    -0.01
9.  Maryland              7-4   65.9    0.98    0.99    -0.01
10. Indiana               7-4   64.5    1.11    1.14    -0.03
11. Michigan              6-6   58.9    1.00    1.03    -0.03
12. Nebraska              5-6   61.3    0.94    0.98    -0.04
13. Northwestern          1-9   60.1    1.00    1.13    -0.13
14. Rutgers              2-10   63.9    0.90    1.05    -0.15

AVG.                            62.5    1.04
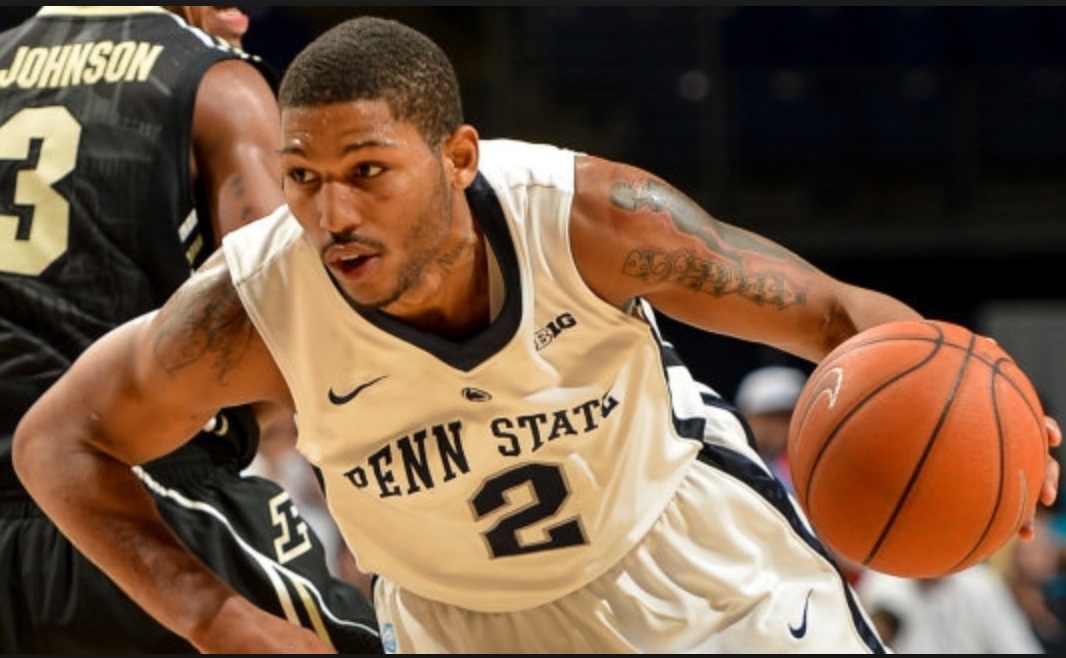
He’s the hardest-working man in the Big Ten.
Tomorrow night Penn State’s playing a game at Ohio State that the Nittany Lions are very likely to lose, so this may seem like an odd moment to throw a bouquet to Pat Chambers. Be that as it may, PSU has a defense that has very clearly been better than the Big Ten average. That is news, in the sense that it’s the first time in Chambers’ tenure that Penn State has been better than average on either side of the ball.
And all it got the Lions was three wins and eight losses. There’s a lot of close-game heartbreak in that record, as you’d expect, but then again with this offense PSU is hard pressed to play anything but close games to begin with.
Don’t blame D.J. Newbill. In conference play he carries a larger sack of possessions around than any other player in the Big Ten and yet he’s still managed to make half his twos. Newbill’s main challenge on offense is that the best perimeter shooter on his team might be a guy named D.J. Newbill, and he’s actually not that great from out there.
Let’s see, tough defense, maniacally overworked featured scorer who arrived as a transfer, school acquired by the Big Ten to improve the conference’s football, historically benighted basketball program — it all adds up. When Chambers starts tweeting at halftime, the parallels to Nebraska 2014 will be complete.
Melo Trimble says winning close and losing big sure beats a finger in the eye. The fact that Maryland’s gone 7-4 while actually being outscored by opponents is attributable to three lopsided losses on the road to Indiana, Ohio State, and, most recently, Iowa. (The loss at Illinois wasn’t all that lopsided.) If you’re a fan filling out a bracket in March you’ll want to take the very nice seed that the Terrapins get with a grain of salt. And if you’re a Maryland fan you’ll want to tell any skeptics that UConn lost three games by double-digits last year too.
The UCLA riddle
Pac-12                    W-L   Pace    PPP   Opp. PPP    EM
1.  Utah                  8-2   61.8    1.16    0.89    +0.27
2.  Arizona               8-2   65.0    1.13    0.89    +0.24
3.  Stanford              7-4   66.6    1.12    1.04    +0.08
4.  Oregon                7-4   67.3    1.09    1.09     0.00
5.  UCLA                  6-5   63.8    1.01    1.02    -0.01
6.  Oregon State          7-4   60.1    0.92    0.93    -0.01
7.  Arizona State         4-6   65.0    1.00    1.02    -0.02
8.  Colorado              4-6   65.3    0.99    1.03    -0.04
9.  Washington            3-8   65.3    1.03    1.09    -0.06
10. Cal                   5-6   68.0    0.95    1.06    -0.11
11. USC                  1-10   68.5    0.92    1.06    -0.14
12. Washington State      4-7   66.8    1.02    1.16    -0.14

AVG.                            65.3    1.03
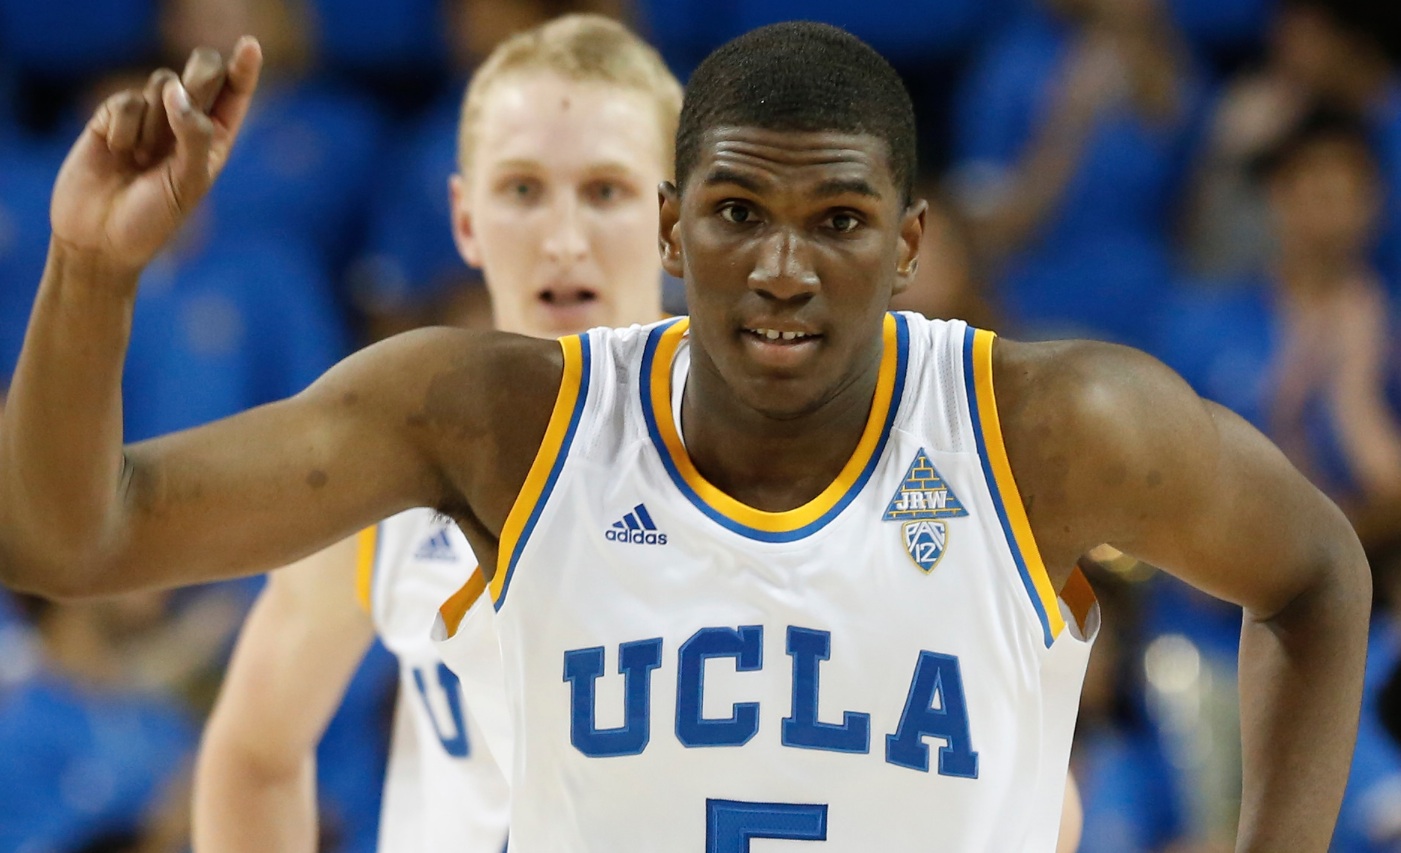
Kevon Looney will be a lottery pick in 136 days.
That sound you hear is a bandwagon that didn’t quite get going — yet. For a heartbeat there UCLA looked like it was putting the pieces together. Three straight wins — including victories against the NCAA tournament-caliber likes of Utah and Stanford — had many observers ready to return the Bruins to the Pac-12’s discursive penthouse. Then Steve Alford’s team lost a nail-biter to Cal in Berkeley, and such talk is now on hold pending further developments.
The thing that has to give you continuing pause where UCLA’s concerned is that this is simply an atrocious bunch of shooters. In fact in Pac-12 play only USC has had less success from the field. The Bruins are making just 45 percent of their twos and 32 percent of their threes against league opponents, and as a duo Bryce Alford and Isaac Hamilton are converting just 34 percent of their tries inside the arc (again, in Pac-12 play).
That UCLA has been able to score a point per trip in the face of such shooting is surely a tribute to the power of offensive boards and, to a lesser extent, to the importance of taking care of the ball. In a league that doesn’t try for offensive rebounds, the Bruins dare to answer that call. (So too, of course, does Arizona.) Indeed if not for Tony Parker and Kevon Looney cleaning up their teammates’ misses, you’re looking at a full-blown USC-variety scoring desert.
Looney will be a lottery pick come summer, but in his brief window of time as a college player he’s neither a volume scorer nor a particularly disruptive defender as a 4-man. (He’s recorded one block in his last 239 defensive possessions.) The freshman has NBA talent and the name on his uniform is not lacking for pedigree, but until his teammates knock down some shots the wait for the Bruins to be “back” will be ongoing.
Your viewer’s guide to LSU
SEC                       W-L   Pace    PPP   Opp. PPP    EM
1.  Kentucky             10-0   60.7    1.13    0.89    +0.24
2.  Ole Miss              7-3   67.2    1.11    1.03    +0.08
3.  Arkansas              7-3   68.7    1.05    0.98    +0.07
4.  Texas A&M             7-3   62.3    1.03    0.98    +0.05
5.  LSU                   6-4   69.3    1.00    0.97    +0.03
6.  Florida               5-5   63.5    1.01    1.00    +0.01
7.  Georgia               6-4   64.3    1.03    1.02    +0.01
8.  Tennessee             5-5   61.7    0.99    0.99     0.00
9.  Alabama               4-6   59.8    1.01    1.01     0.00
10. Vanderbilt            3-7   63.7    0.99    1.02    -0.03
11. Auburn                3-7   66.1    1.02    1.10    -0.08
12. Mississippi State     4-6   65.3    0.95    1.04    -0.09
13. South Carolina        2-8   64.1    0.92    1.02    -0.10
14. Missouri              1-9   61.5    0.92    1.13    -0.21

AVG.                            64.1    1.01
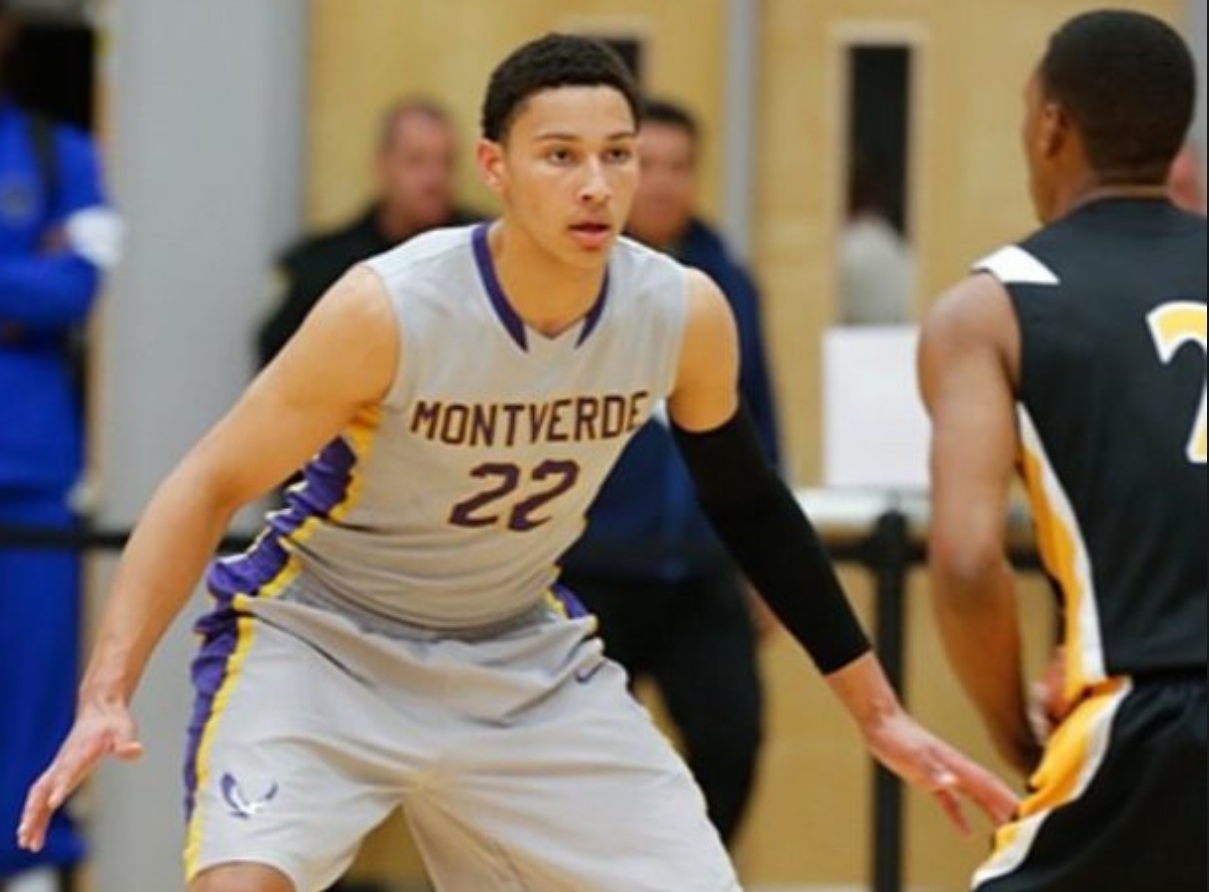
Johnny Jones could use Ben Simmons in uniform tonight. Alas.
Tonight Kentucky puts its perfect season on the line against LSU in Baton Rouge. The Tigers have the No. 1 player in the nation due to arrive next season in the form of Ben Simmons, but in the meantime they’re relying mostly on defense.
Mark down Johnny Jones’ group as one of the three teams who are, rather surprisingly, making SEC opponents miss a higher percentage of twos than what UK’s defense can claim. (The other two are Texas A&M and Vanderbilt. As noted on Sunday at Insider, the Wildcats’ last four opponents have actually connected on 55 percent of their twos.) Speaking of surprises, the tough interior D has enabled LSU to hold every conference opponent to less than a point per trip so far this season — every opponent, that is, except…Auburn? The “other” Tigers gashed the Bayou Bengals for 81 points in 74 possessions, and did it in Baton Rouge last Thursday night. Geaux figure.
It has fallen to 6-8 sophomore wing-slash-4-man Jordan Mickey to have some of his best games in some of his team’s worst losses. In LSU’s 73-67 defeat at the hands of lowly Mississippi State in Starkville, Mickey recorded a 25-20 double-double. And make no mistake, an ostentatiously high number like that from Mickey for defensive rebounds would be most welcome against Kentucky. Over the course of the conference season the Tigers as a team have been weak when it comes to pulling down opponents’ misses.
Amaze your friends. This is the kind of fact we used to get from Billy Packer but that now goes sadly unbrandished: John Calipari’s first season at Memphis was 2000-01. He replaced none other than Jones, who had served as the Tigers’ interim head coach during the 1999-2000 season.
Game of the year of the week tonight in Philly
American                  W-L   Pace    PPP   Opp. PPP    EM
1.  SMU                  10-2   61.6    1.11    0.91    +0.20
2.  Cincinnati            8-3   59.6    1.04    0.91    +0.13
3.  Tulsa                10-1   63.6    1.03    0.90    +0.13
4.  Temple                8-3   65.5    0.97    0.89    +0.08
5.  Memphis               6-4   64.8    1.03    0.96    +0.07
6.  Connecticut           6-4   61.1    1.00    0.94    +0.06
7.  Tulane                4-7   61.7    0.95    1.00    -0.05
8.  East Carolina         3-7   58.3    0.97    1.08    -0.11
9.  UCF                   2-9   63.9    0.99    1.14    -0.15
10. Houston               1-9   63.5    0.91    1.08    -0.17
11. South Florida        1-10   60.5    0.87    1.07    -0.20

AVG.                            62.2    0.99
Tonight Cincinnati plays at Temple, and while the Bearcats are currently showing up in the mock brackets on the No. 9 line or thereabouts the Owls still have work to do. Interim UC head coach Larry Davis can take some credit for Temple’s plight. The last time these two teams met, the Bearcats won by 31.
The Owls have won five straight since that blowout, including Saturday’s thriller at Memphis. During this 5-0 stretch Fran Dunphy’s men have been smothering opposing offenses. No opponent has scored better than 0.91 points per possession over the last five games, and Will Cummings has been recording steals at a high rate.
Which is on-point because Cincinnati has the worst turnover rate of any team in American play. Indeed the only time UC’s held on to the rock in a game against an opponent from the league’s top half was when Davis’ men trounced Temple back on January 17. Watch the turnovers.
Defense and overdue adulation in Kingston
A-10                      W-L   Pace    PPP   Opp. PPP    EM
1.  Dayton                7-3   63.4    1.10    0.96    +0.14
2.  VCU                   8-2   68.1    1.03    0.92    +0.11
3.  Davidson              6-4   64.6    1.15    1.04    +0.11
4.  Richmond              5-5   63.4    1.09    0.98    +0.11
5.  Rhode Island          8-2   66.0    0.95    0.89    +0.06
6.  George Washington     7-3   61.0    1.02    1.00    +0.02
7.  UMass                 7-3   64.3    1.00    0.99    +0.01
8.  St. Bonaventure       6-4   62.6    1.03    1.04    -0.01
9.  La Salle              5-5   63.2    0.93    0.94    -0.01
10. Saint Joseph's        4-6   64.1    0.98    1.00    -0.02
11. George Mason          2-8   63.4    0.95    1.05    -0.10
12. Saint Louis           2-8   63.8    0.95    1.07    -0.12
13. Fordham               1-9   68.8    0.93    1.06    -0.13
14. Duquesne              2-8   65.6    0.99    1.15    -0.16

AVG.                            64.5    1.01
I for one applaud the Virginia-fueled celebration of good team defense that is sweeping the nation, and I now demand that space be carved out within all that love for Rhode Island. The Rams have held A-10 opponents to even fewer points on each possession than what we’ve seen from Tony Bennett’s shockingly permissive Cavaliers in ACC play.
Speaking of the guy from Charlottesville, behold the eerily Bennett-like turnaround being engineered by Dan Hurley in Kingston:
2013: 8-21 (3-13 A-10)
2014: 14-18 (5-11)
2015: 16-5 (8-2)
The Rams’ feast-or-feast defense simultaneously forces turnovers and misses. And Hurley apparently subscribes to the Mike Krzyzewski/Bo Ryan belief that the best way to avoid being beaten from the perimeter is to prevent opponents from even attempting a three. In A-10 play just 23 percent of opponents’ shots have been launched from beyond the arc.
Now the bad news. URI’s turnover rate can be charitably termed “catastrophic,” and these guys were fortunate to come away from their visit to Fordham with a win. Most importantly my colleague Joe Lunardi says E.C. Matthews and company are currently on the wrong side of the bubble. I’ll keep you posted.
Is this the slowest-paced league ever?
Missouri Valley           W-L   Pace    PPP   Opp. PPP    EM
1.  Wichita State        11-1   58.8    1.13    0.87    +0.26
2.  Northern Iowa        11-1   56.0    1.10    0.91    +0.19
3.  Illinois State        7-5   63.0    1.04    0.92    +0.12
4.  Indiana State         8-4   64.0    1.05    1.02    +0.03
5.  Evansville            6-6   63.4    0.99    1.01    -0.02
6.  Southern Illinois     3-9   60.3    0.92    0.99    -0.07
7.  Loyola                4-8   58.0    0.97    1.05    -0.08
8.  Bradley               3-9   61.2    0.93    1.03    -0.10
9.  Missouri State        3-9   58.8    0.90    1.03    -0.13
10. Drake                 4-8   56.9    0.97    1.16    -0.19

AVG.                            60.0    1.00
As indicated by the figures you see here, the Valley is perched on the very knife edge of tempo infamy. Any more games between Drake and Northern Iowa and this conference’s overall number for average pace will surely drop below the magic 60 mark. That would indeed distinguish the Missouri Valley as the slowest league ever. (“Ever” meaning, as always in sports discussions, over the past couple years. “League” meaning, as always in college basketball discussions, a conference from D-I’s top third.)
Slowest Tuesday Truths conferences, 2011-15
Conference games only
                                      Pace
Missouri Valley        2015           60.0
Mountain West          2015           61.7
ACC                    2014           61.8
Big Ten                2011           62.0
Bringing an entire league in under 62 possessions per 40 minutes is really hard to do, but this season the Valley’s smashing that mark with ease.
If you’ve been reading along here for a while, you know the party line around these parts on pace. Basically concern attaches collectively, not individually. If you can succeed by going slow, by all means do so: Virginia now and Georgetown in 2007, I salute you. If on the other hand your entire conference — the bad teams, the good ones, and the ones in between — is puttering along at just 60 clicks per game, it is most certainly time to pop open the hood and see what’s going on.
I am loving this “no San Jose State” thing
Mountain West             W-L   Pace    PPP   Opp. PPP    EM
1.  Boise State           7-3   62.1    1.14    1.00    +0.14
2.  Colorado State        7-4   65.5    1.12    0.99    +0.13
3.  San Diego State       8-3   59.2    1.01    0.90    +0.11
4.  New Mexico            6-5   59.7    1.02    0.96    +0.06
5.  Utah State            6-5   60.8    1.00    0.96    +0.04
6.  UNLV                  4-6   63.7    1.08    1.04    +0.04
7.  Wyoming               8-3   58.4    0.99    0.98    +0.01
8.  Fresno State          6-4   63.5    0.98    0.98     0.00
9.  Air Force             4-8   59.4    1.05    1.11    -0.06
10. Nevada                3-7   63.3    0.96    1.07    -0.11
11. San Jose State       0-11   63.3    0.78    1.12    -0.34

AVG.                            61.7    1.01
Last week I introduced the “what if San Jose State had never been born” version of the Mountain West standings, and great Zuzu’s petals the response has been epochal. From coast to coast hoops fans gathered in mass spontaneous euphoria to celebrate the idea of per-possession stats cleansed of the distorting effects of games played against one historically hapless cellar-dweller.
Subtracting out all games played against the Spartans, the Mountain West now looks like this:
The “San Jose State was never born” standings
Mountain West             W-L   Pace    PPP   Opp. PPP    EM
1.  San Diego State       8-3   59.2    1.01    0.90    +0.11
2.  Colorado State        6-4   65.8    1.12    1.02    +0.10
3.  Boise State           6-3   61.5    1.12    1.06    +0.06
4.  New Mexico            5-5   59.3    1.02    1.00    +0.02
5.  Wyoming               7-3   58.6    0.98    0.97    +0.01
6.  Utah State            5-5   60.8    1.00    1.00     0.00
7.  UNLV                  3-6   63.6    1.08    1.09    -0.01
8.  Fresno State          4-4   63.1    0.92    0.99    -0.07
9.  Nevada                2-7   62.7    0.97    1.10    -0.13
10. Air Force             2-8   59.1    1.03    1.16    -0.13

AVG.                            61.4    1.02
This might be a fair sum-up of the Mountain West. San Diego State and Colorado State have played as well as any of their rivals in what is clearly a down year for the league. That being said, the Aztecs looked dreadful losing by 15 at Boise State on Sunday evening, and Derrick Marks and the Broncos — even with the SJSU Inflation Dynamic factored out — are coming up fast on the far turn. Lastly, Wyoming has parlayed break-even scoring against non-Spartan opponents into a rather incredible and indeed almost Maryland-esque won-loss record.
That 2013 Gonzaga team was amazing (a continuing series)
West Coast                W-L   Pace    PPP   Opp. PPP    EM
1.  Gonzaga              12-0   64.0    1.21    0.96    +0.25
2.  BYU                   8-5   69.8    1.17    1.04    +0.13
3.  Saint Mary's         10-2   60.7    1.12    1.00    +0.12
4.  Pepperdine            8-5   62.4    1.02    1.01    +0.01
5.  San Diego             6-7   63.2    0.97    0.98    -0.01
6.  Portland              5-7   65.6    1.06    1.09    -0.03
7.  San Francisco        3-10   65.1    1.04    1.14    -0.10
8.  Loyola Marymount      4-9   60.0    1.07    1.17    -0.10
9.  Pacific              2-10   60.6    1.00    1.14    -0.14
10. Santa Clara           5-8   59.9    0.99    1.14    -0.15

AVG.                            63.1    1.07
The best information I can pull together suggests that Gonzaga two years ago (+0.30) was as good as the team you see in Spokane today, meaning “national championship-good.” If one accepts this premise, then the sequence that subsequently unfurled is quite possibly the best evidence we have that the hoops gods do have a sense of humor:
- Gonzaga played like an elderly frog on sedatives against Southern in the round of 64 and very nearly supplied history’s first 16-over-1 upset before escaping 64-58.
- In the round of 32 the Bulldogs were paired with No. 9 seed Wichita State, a team that on paper was not as strong as the group of Shockers that was upset by VCU in the round of 64 the previous year.
- The nominally not-as-strong-as-before Shockers proceeded to make more threes than any WSU team had in 10 years (and more than any WSU team has since), on their way to the Final Four.
- In 2014 Wichita State, undefeated and seeded on the top line, fell in the round of 32 by two points to a Final-Four-bound Kentucky team that shot 44 percent from beyond the arc after ranking No. 11 in SEC play in three-point accuracy.
Personally I can envision top-seeded Gonzaga reaching the 2015 Sweet 16 with ease, and it will be one of those things where all the following week we kind of wonder what the big deal was about saying they couldn’t possibly do it. (Think Bo Ryan and Wisconsin making the 2014 Final Four.) But maybe the hoops gods have something else planned. They’re certainly on a roll.
— — —
#TBT Tuesday edition
Good times, 10 years ago today.

Alas, my money quotes on hooping it up for Clark Barnes at Springfield High School were consigned to the cutting room floor. Urbana High still shudders when they see me coming!
