
“Good game. You’re shorter than you look on TV.” (USA Today)
Welcome, casual fan. Some play call, huh? Turning to what truly matters, here’s a 60-word synopsis of the college hoops season so far:
Kentucky is good. So are Gonzaga and Virginia. Duke is likely overrated at the moment, and Arizona is probably underrated. Scoring is down, but not as much as you’ll hear and not at all uniformly. Scoring is actually up in ACC play, but good luck finding a pundit to throw that confetti. (Though I guess I kind of just did.)
Good stuff, right? It’s a fine sport, truly. Read on….
Welcome to Tuesday Truths, where I look at how well 131 teams in the nation’s top 11 conferences are doing against their league opponents on a per-possession basis.
The unusually adequate Notre Dame defense
Through games of February 2, conference games only
Pace: possessions per 40 minutes
PPP: points per possession Opp. PPP: opponent PPP
EM: efficiency margin (PPP – Opp. PPP)
ACC                       W-L   Pace    PPP   Opp. PPP    EM
1.  Virginia              8-1   57.2    1.11    0.92    +0.19
2.  Louisville            6-2   65.2    1.10    1.01    +0.09
3.  Notre Dame            8-2   61.9    1.16    1.07    +0.09
4.  North Carolina        7-3   67.8    1.10    1.03    +0.07
5.  Duke                  5-3   66.4    1.11    1.06    +0.05
6.  NC State              5-5   64.3    1.08    1.05    +0.03
7.  Syracuse              5-3   65.4    1.01    1.01     0.00
8.  Miami                 4-4   62.2    1.04    1.05    -0.01
9.  Clemson               5-4   60.0    0.98    0.99    -0.01
10. Florida State         4-5   62.6    1.04    1.10    -0.06
11. Georgia Tech          1-8   60.7    0.97    1.03    -0.06
12. Pitt                  4-5   60.3    1.06    1.13    -0.07
13. Wake Forest           2-7   67.5    1.01    1.09    -0.08
14. Virginia Tech         1-7   63.0    0.98    1.12    -0.14
15. Boston College        1-7   60.5    0.97    1.12    -0.15

AVG.                            63.0    1.05
Notre Dame was just upset by an opponent that hadn’t previously done much of anything, so this is perhaps a good non-bandwagon moment to make an affirming point: Mike Brey likely has one of the best teams he’s ever had in South Bend.
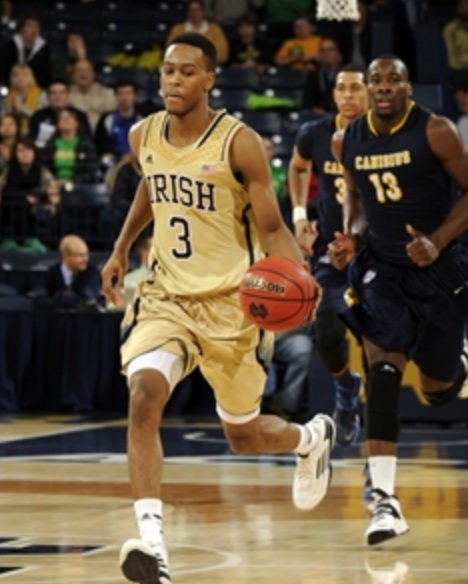
At 54 percent, V.J. Beachem is the worst 2-point shooter in Notre Dame’s rotation.
As a program the Fighting Irish have a reputation for being excellent on offense and so-so on D. That reputation is on the money. (I know it might seem like I’m always running around having a go at what I view as misperceptions, but sometimes the popular conception’s exactly right. Conventional wisdom, I salute you!) The difference this season is that: a) ND might have not merely an excellent offense but possibly the best one in the country; and b) Brey’s perennially below-average defense is not too terribly far below average….
Defensive ranks in ACC play
             Opp.    Opp.           Opp.           Opp.
             eFG%    TO%    DR%   FTA/FGA          PPP
Notre Dame    8       14    11       1             10
One way to think of those numbers is “that’ll do.” The offense looks like this:
Offfensive ranks in ACC play
             eFG%    TO%    OR%   FTA/FGA          PPP
Notre Dame    1       2     12       9              1
Games involving Notre Dame will customarily be turnover-free, and the Irish most certainly won’t dominate on the boards. Yet within those boundaries more often than not the ND offense is going to generate more points than the opposing offense.
In other words the adequacy of the Notre Dame defense is a function not only of its intrinsic merit but also of the happy fact that it plays in tandem with a seven-man rotation that for the season is shooting 60.2 percent on its twos. Brey has a real opportunity to shake the “can’t get it done in March” label with this group in 2015.
How to think about a .500-ish team in D-I’s No. 1 league
Big 12                    W-L   Pace    PPP   Opp. PPP    EM
1.  Kansas                8-1   68.3    1.09    0.95    +0.14
2.  Oklahoma              5-4   66.2    1.05    0.95    +0.10
3.  West Virginia         6-2   72.8    1.02    0.95    +0.07
4.  Baylor                4-4   61.2    1.05    1.02    +0.03
5.  Iowa State            6-3   70.5    1.09    1.07    +0.02
6.  Oklahoma State        4-5   62.9    0.97    0.95    +0.02
7.  Kansas State          5-4   61.9    0.96    0.98    -0.02
8.  Texas                 3-5   65.4    1.01    1.04    -0.03
9.  TCU                   1-7   65.5    0.94    1.02    -0.08
10. Texas Tech            1-8   64.5    0.84    1.12    -0.28

AVG.                            65.9    1.00
One working assumption I have about a good team is that you should be able to outscore your league even if you’re in the best conference in the country. For example back in the day when the Big Ten was regularly the top-rated conference in D-I, it was customary for a team like, say, Iowa or Minnesota to hang around .500 in league play and be well-loved by laptops. I understand the rationale behind that automated evaluation, but as a carbon-based life form I’m not especially swayed when the best thing you can say about a team is that the opponent they lost to is really good.
Which brings me to Baylor, 4-4 in the strongest conference in the country. The Bears are well-loved by laptops and ranked by humans. I’ve joined that second party this week and added Scott Drew’s men to my ballot for our Power Rankings at ESPN.com. Here’s my thinking….
What’s cool about Baylor is the combination of three-point shooting and offensive rebounding. Duke won a national title with that combination — and despite abysmal production inside the arc — in 2010. And so thorough is the tribute being paid by Scott Drew to Mike Krzyzewski’s team from five years ago that the Bears have also chosen to be completely hapless on 2s (shooting just 39.9 percent on them against Big 12 opponents).

This probably came on a put-back. Rico Gathers is pretty fair on the offensive glass. (nola.com)
If this comparison holds water then Rico Gathers is the Brian Zoubek figure in Waco. In Big 12 play he’s right at 1-in-5 in terms of Baylor misses that he personally hauls down during his minutes. Between Gathers’ offensive boards and the threes supplied by Kenny Chery and Lester Medord, BU may yet make the laptops look smart.
Don’t necessarily accept Oklahoma’s numbers at face value. The Sooners’ impressive appearance in the table above is based in no small part on the 81-36 beat-down OU inflicted upon Texas Tech last week. Take away that single outcome and you’re looking at an Oklahoma team that’s been just 0.03 points better than the rest of the league on each possession.
I don’t believe in three-point bans, but in Providence’s case I’ll make an exception
Big East                  W-L   Pace    PPP   Opp. PPP    EM
1.  Villanova             6-2   64.1    1.12    0.99    +0.13
2.  Georgetown            7-3   62.8    1.06    0.98    +0.08
3.  Butler                6-3   64.3    1.06    1.01    +0.05
4.  Xavier                5-5   65.7    1.09    1.06    +0.03
5.  Providence            6-3   63.9    1.05    1.03    +0.02
6.  Seton Hall            5-4   64.5    1.06    1.07    -0.01
7.  St. John's            3-5   65.5    1.06    1.09    -0.03
8.  Marquette             2-7   63.9    0.99    1.04    -0.05
9.  DePaul                5-5   64.6    1.03    1.09    -0.06
10. Creighton             1-9   62.3    0.94    1.09    -0.15

AVG.                            64.2    1.05

That look from Ed Cooley says: “Whatever you do, don’t try a three.” (friarbasketball.com)
If memory serves correct Lute Olsen once imposed an informal and not truly total but nevertheless overtly stated three-point ban on his hapless Arizona shooters late in his career. At the time I thought that was ill-advised. Telling opponents in advance that you don’t plan to shoot threes makes you an easier scout.
I still think a flat-out ban is likely to be counterproductive, but I’ll grant that if ever a team had grounds to just stop trying from out there it is surely Providence.
Worst teams from the perimeter
                    3FG%
TCU                 26.0
Providence          26.9
Xavier              27.5
Nebraska            27.6
Purdue              28.3

Major-conference games only
The Friars are average in terms of taking care of the ball, pretty good inside the arc (making a hair less than half their twos in Big East play), and strong on the boards at both ends of the floor. In conference play the most weighty disadvantage this team suffers from — and it’s huge — is simply that opposing teams are way better at making threes. If Ed Cooley chooses to pull a Lute, I won’t cast the first stone.
This is the most Izzo year we’ve seen from Izzo in a while
Big Ten                   W-L   Pace    PPP   Opp. PPP    EM
1.  Wisconsin             7-1   57.1    1.27    1.04    +0.23
2.  Ohio State            6-3   63.4    1.12    1.03    +0.09
3.  Michigan State        6-3   63.7    1.06    0.97    +0.09
4.  Purdue                6-3   63.0    1.06    1.01    +0.05
5.  Minnesota             3-7   64.9    1.01    1.01     0.00
6.  Maryland              6-3   65.8    1.00    1.00     0.00
7.  Michigan              6-4   59.5    0.99    0.99     0.00
8.  Indiana               6-3   65.0    1.10    1.11    -0.01
9.  Penn State            2-7   64.1    1.01    1.04    -0.03
10. Illinois              4-5   63.5    0.99    1.04    -0.05
11. Nebraska              4-5   61.6    0.93    0.98    -0.05
12. Iowa                  4-4   60.1    1.10    1.17    -0.07
13. Northwestern          1-7   61.1    1.01    1.10    -0.09
14. Rutgers               2-8   63.3    0.91    1.05    -0.14

AVG.                            62.6    1.04
No one’s talking about Michigan State because, well, actually I don’t know why no one’s talking about Michigan State. The Spartans are 6-3 in the Big Ten, same as Ohio State and Maryland, and everyone’s happy to rank those teams. I suppose if you lose at home to Texas Southern people tend to be somewhat skeptical thereafter. Fair enough.

Branden Dawson. “I think, therefore I rebound.” (freep.com)
All I know is these guys are living up to their coach’s reputation on the glass for the first time in several years.
Michigan State ranks in Big Ten play
             OR%        DR%
2015          2          1
2014          4          3
2013          5          3
Branden Dawson has now recorded double-doubles in four of his last five games, and as a team MSU’s rebounding 76 percent of opponents’ misses in Big Ten play. And while it’s true this offense isn’t what you’d term poetry in motion, the Spartans are entering a soft portion in their schedule. Expect to hear about these guys “maturing” and “coming together” in the very near future.
Stanford’s weird, needless, suicidal fouling
Pac-12                    W-L   Pace    PPP   Opp. PPP    EM
1.  Arizona               8-1   64.3    1.13    0.86    +0.27
2.  Utah                  7-2   61.6    1.16    0.90    +0.26
3.  Stanford              6-3   65.9    1.15    1.07    +0.08
4.  Colorado              4-5   65.5    1.01    1.01     0.00
5.  UCLA                  5-4   63.5    1.02    1.02     0.00
6.  Arizona State         3-6   64.4    0.98    1.01    -0.03
7.  Oregon                5-4   67.4    1.04    1.08    -0.04
8.  Washington            3-6   65.9    1.04    1.08    -0.04
9.  Oregon State          5-4   59.7    0.91    0.96    -0.05
10. Washington State      4-5   67.1    1.04    1.17    -0.13
11. Cal                   3-6   67.9    0.94    1.09    -0.15
12. USC                   1-8   67.5    0.93    1.08    -0.15

AVG.                            65.0    1.03
The Pac-12’s a relatively low-foul league, but you sure wouldn’t know it if you’ve been watching Stanford. Opponents have shot 35 or more free throws four times in the Cardinal’s first nine conference games.

If this wasn’t called a foul, one soon occurred. (miamiherald.com)
Free throw rates are socially conditioned — you see higher rates in the leagues where the refs crave the camera — so I like to measure fouling according to where a given team nets out relative to its league average. Here’s how Johnny Dawkins’ team looks on that front….
Hack Factor (HF)
Opponent FTA/FGA, standard deviations above league mean
                       HF
Stanford              2.48
South Carolina        2.30
West Virginia         2.26
DePaul                1.66
Purdue                1.43

Major-conference games only
Posting a higher Hack Factor than Frank Martin is kind of like being less precise than the RPI, and this state of affairs is all the more curious coming from a high-scoring group coached by a former star guard for Duke. If you ask where this is coming from, there’s no good answer. It just happened: Stanford fouled less often than the league average just last year.
The Cardinal may end the season with the most efficient offense in the Pac-12, Chasson Randle is quite possibly the conference’s best player not named “Stanley” or “Delon,” and this defense is average in every area except hacking. Everything’s in place in Palo Alto for a solid performance as the league’s third-best team. Just stop fouling.
Kentucky’s predictable success has been achieved in an unpredictable way
SEC                       W-L   Pace    PPP   Opp. PPP    EM
1.  Kentucky              8-0   60.2    1.14    0.88    +0.26
2.  Ole Miss              5-3   66.7    1.11    1.04    +0.07
3.  Florida               5-3   63.7    1.02    0.98    +0.04
4.  Texas A&M             6-2   61.8    1.02    0.98    +0.04
5.  LSU                   5-3   69.3    0.99    0.96    +0.03
6.  Tennessee             5-3   62.1    1.00    0.97    +0.03
7.  Georgia               5-3   65.0    1.05    1.03    +0.02
8.  Arkansas              5-3   67.7    1.07    1.07     0.00
9.  Alabama               3-5   59.2    1.01    1.02    -0.01
10. South Carolina        2-6   63.6    0.95    1.01    -0.06
11. Vanderbilt            1-7   64.5    0.97    1.04    -0.07
12. Mississippi State     3-5   65.1    0.98    1.06    -0.08
13. Auburn                2-6   64.6    0.99    1.09    -0.10
14. Missouri              1-7   61.8    0.92    1.11    -0.19

AVG.                            63.9    1.02
John Calipari’s group hasn’t been the SEC’s best team in terms of offensive rebounding in conference play, and that has surprised me. That particular honor currently resides with Arkansas, and for good measure Texas A&M and Mississippi State (yes, Mississippi State) have also recorded higher offensive rebound percentages than what we’ve seen thus far from the plucky band of overachievers in Lexington.
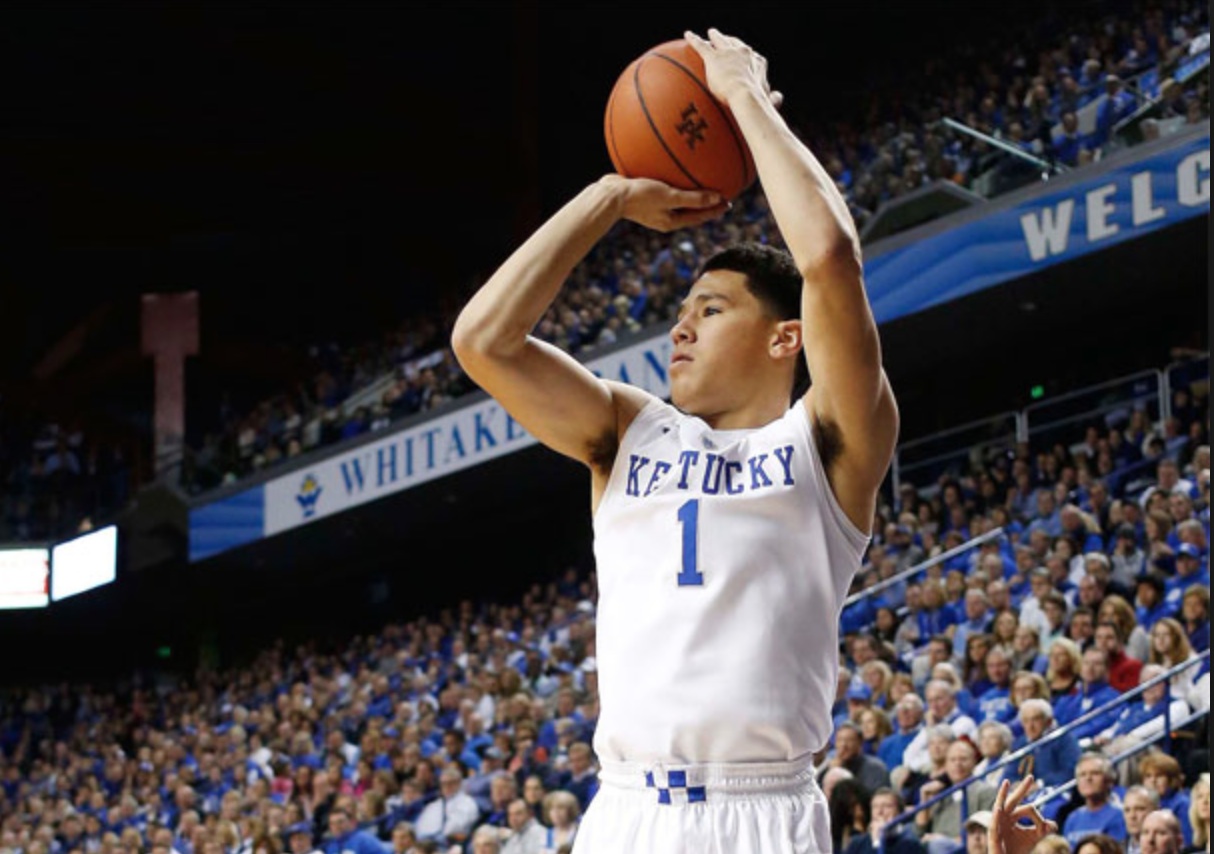
UK MVP? (kentuckysportsradio.com)
Nor have the Wildcats played the best interior defense in the league. That distinction belongs to the aforementioned Aggies, who have held conference opponents to a figure for two-point accuracy that’s exactly two percentage points lower than what UK’s allowed. And speaking of two-point accuracy, on offense Calipari’s guys currently rank No. 9 in SEC play in that category.
But what Kentucky has been is the most accurate team in the conference from beyond the arc. In fact the Cats have very nearly been the best major-conference team in the country when it comes to making threes.
Best teams from the perimeter
                    3FG%
Stanford            44.1
Kentucky            43.3
Georgia             41.8
Colorado            40.6
Kansas              40.1

Major-conference games only
Pairing this defense with an offense that not only hits threes but also takes excellent care of the ball has made Kentucky invulnerable — so far. I did not expect that the February scout on this team would be to get the ball out of Devin Booker’s hands. Make one of those lottery picks in the paint beat you instead.
Is this a normal bad pre-national-title season from UConn or just a bad season?
American                  W-L   Pace    PPP   Opp. PPP    EM
1.  SMU                   9-1   61.8    1.13    0.89    +0.24
2.  Tulsa                 9-0   63.8    1.05    0.90    +0.15
3.  Cincinnati            6-3   59.8    1.03    0.90    +0.13
4.  Memphis               6-3   64.5    1.04    0.96    +0.08
5.  Temple                6-3   65.7    0.97    0.90    +0.07
6.  Connecticut           4-4   62.0    0.97    0.95    +0.02
7.  Tulane                4-6   61.4    0.96    1.00    -0.04
8.  East Carolina         2-6   59.2    0.95    1.09    -0.14
9.  UCF                   2-8   64.4    1.00    1.14    -0.14
10. Houston               1-8   63.8    0.93    1.09    -0.16
11. South Florida         1-8   60.4    0.87    1.08    -0.21

AVG.                            62.4    0.99
Connecticut is rather notorious for looking like an elderly and heavily sedated frog in the rain during the regular season and then promptly waking up in mid-March and winning a national title. It happened in 2011, and I was there in person to see it happen again in 2014.
Is Kevin Ollie hatching his most brilliant game of possum to date? Not likely.
UConn regular-season Elderly and Heavily Sedated Frog in the Rain factor (EHSFITR)
        EM in-conf      Conf rating         EHSFITR
2011       +0.01           .8313            Moderate
2014       +0.11           .7339             So-So
2015       +0.02           .6017           Really high

Conf ratings: kenpom.com
These guys at Connecticut aren’t even playing as well as their listless regular-season predecessors did. For an example of a past team that outscored a conference as middling as this season’s American by a margin as middling as that being shown by UConn, you’d have to look at an outfit as unprepossessing as, say, Boise State last year. Not an inspiring precedent.
Stay off my side, please! Last week I wrote that the primal forces of Excellent Offense had been uncovered by Bo Ryan, and that the secret to consistently scoring a high number of points consistently is to never commit turnovers while also crashing one’s own offensive glass. Apparently Houston head coach Kelvin Sampson read this, slapped his forehead with “Aha!” gusto, and ran right out and coached his team to an incredible Ryan-esque one-turnover performance at home against UConn. Alas, all the Cougars got out of it was 70 points in 70 possessions — well, that and a two-point win at home over the defending national champions. Still, Coach Sampson, you do me no favors in this discussion, sir. Next time do better than 14 percent on the offensive boards.
Dayton has vaporized the height-rebounding correlation for all times
A-10                      W-L   Pace    PPP   Opp. PPP    EM
1.  Dayton                7-2   64.0    1.12    0.95    +0.17
2.  Richmond              5-3   61.4    1.13    0.98    +0.15
3.  VCU                   7-1   69.0    1.01    0.89    +0.12
4.  Davidson              5-3   64.4    1.14    1.05    +0.09
5.  Rhode Island          7-2   65.1    0.93    0.88    +0.05
6.  George Washington     6-3   61.2    1.03    1.00    +0.03
7.  La Salle              4-4   62.4    0.93    0.93     0.00
8.  St. Bonaventure       4-4   62.4    1.03    1.04    -0.01
9.  UMass                 5-3   63.7    0.98    0.99    -0.01
10. Saint Joseph's        3-5   64.5    1.00    1.02    -0.02
11. George Mason          2-6   63.2    0.97    1.06    -0.09
12. Duquesne              2-7   65.4    0.99    1.12    -0.13
13. Saint Louis           1-7   63.6    0.94    1.08    -0.14
14. Fordham               0-8   68.8    0.88    1.07    -0.19

AVG.                            64.2    1.00
I’ll never again equate a superficial and clearly secondary matter like, you know, how tall the members of a basketball team are with how well that group can rebound. Dayton is crushing the A-10 when it comes to defensive rebounding, and the Flyers — as has been amply documented — are doing so with no regular rotation player taller than 6-6.
Best A-10 teams on the defensive glass
                     DR%
Dayton              74.4
Fordham             71.8
Richmond            70.9
La Salle            70.8

Conference games only
Apparently the parents of Sean and Archie Miller gave their kids a pop-up book all about defensive rebounding, because both Arizona and Dayton are dominating their respective leagues in that area. Then again Sean at least has the benefit of tall players and a league that doesn’t believe in offensive boards anyway. Younger brother Archie has neither of those advantages.
Confounding yet consummate caliph of the caroms Archie Miller, I salute you!
A conference where scoring really is down — grab your torch and pitchfork!
Missouri Valley           W-L   Pace    PPP   Opp. PPP    EM
1.  Wichita State         9-1   58.0    1.13    0.90    +0.23
2.  Northern Iowa         9-1   56.2    1.08    0.90    +0.18
3.  Illinois State        6-4   62.1    1.05    0.94    +0.11
4.  Indiana State         7-3   64.3    1.05    1.03    +0.02
5.  Evansville            6-4   62.9    1.03    1.01    +0.02
6.  Loyola                3-7   58.0    0.96    1.04    -0.08
7.  Missouri State        3-7   58.7    0.93    1.01    -0.08
8.  Southern Illinois     2-8   59.8    0.90    0.99    -0.09
9.  Bradley               2-8   61.0    0.93    1.06    -0.13
10. Drake                 3-7   57.5    0.95    1.15    -0.20

AVG.                            59.8    1.00
A hearty Tuesday Truths salute goes out to Northern Iowa for ending Wichita State’s 27-game win streak (including Arch Madness games) against Valley opponents. If you’ve been reading along here at TT, I hope you were appropriately and resolutely unstunned by that result. UNI’s a really good team that’s made dramatic year-to-year strides on D, and, if you’re WSU, making the 500-mile trek from Wichita more or less due north to Cedar Falls at the end of January is surely no one’s idea of a easy trip.
There will be time enough this season to chart this burgeoning Shocker-Panther rivalry, but today I wish to draft the entire Valley into service for the Scoring is Down discussion. It turns out that in this conference scoring isn’t just down, it has plunged right down to the very center of the zero-points earth.
            Points per 40 minutes
            2014   2015    change
Valley      66.6   59.8    -10.2%

Conference games only
If you want to complain about the fact that scoring is down and you base your indictment on the action you’ve seen in the Valley this season compared to your memories of 2014, the ratiocinative ground under your feet is rock solid. But that’s not usually how the Scoring is Down indictment reads. It’s usually based on data from all of Division I — information that the NCAA or any keeper of the capital-G Game should indeed track, but data that exhibits very little correlation to what you see. Depending on what kind of fan you are, something in the neighborhood of 66 to 95 percent of Scoring is Down data is likely to be based on teams you never watch.
There is also the possibility that, even in its point-starved state, the Valley may actually be a more compelling object of attention now that someone in the league’s able to compete with Wichita State.
It’s a wonderful league
Mountain West             W-L   Pace    PPP   Opp. PPP    EM
1.  Colorado State        6-3   65.2    1.15    0.98    +0.17
2.  San Diego State       7-2   60.0    1.02    0.86    +0.16
3.  Boise State           5-3   63.5    1.13    1.01    +0.12
4.  New Mexico            6-3   60.2    1.04    0.95    +0.09
5.  Utah State            5-4   61.2    0.99    0.93    +0.06
6.  UNLV                  4-5   62.9    1.07    1.02    +0.05
7.  Wyoming               7-2   58.2    1.01    0.97    +0.04
8.  Fresno State          5-4   63.0    0.95    0.99    -0.04
9.  Air Force             2-8   60.1    1.04    1.15    -0.11
10. Nevada                2-6   63.5    0.96    1.10    -0.14
11. San Jose State        0-9   62.2    0.75    1.14    -0.39

AVG.                            61.8    1.01
The evaluative problem with the Mountain West is that San Jose State is going through a basketball apocalypse at the moment, and every team that plays the Spartans comes away looking way better in the Truths than they did before. But I’m not particularly interested in how well a given team can perform in grinding SJSU up into a fine powder.
Therefore I’ve come up with what I might have to start calling the real Mountain West standings. Here’s what the league’s results would look like if we simply subtracted out any games involving the Spartans….
Presenting the “San Jose State was never born” standings
Mountain West             W-L   Pace    PPP   Opp. PPP    EM
1.  San Diego State       7-2   60.0    1.02    0.86    +0.16
2.  Colorado State        5-3   65.5    1.16    1.02    +0.14
3.  UNLV                  4-5   62.9    1.07    1.02    +0.05
4.  New Mexico            5-3   59.8    1.03    0.99    +0.04
5.  Wyoming               6-2   58.4    0.99    0.96    +0.03
6.  Boise State           4-3   62.9    1.11    1.08    +0.03
7.  Utah State            4-4   61.3    0.98    0.97    +0.01
8.  Fresno State          4-4   63.1    0.92    0.99    -0.07
9.  Nevada                2-6   63.5    0.96    1.10    -0.14
10. Air Force             0-8   59.9    1.00    1.22    -0.22

AVG.                            61.8    1.01
I for one find this second telling of the MWC story useful. (Boise State and Air Force in particular look much different in a world without a certain East Bay positive-efficiency-margin ATM.) If the givens of this situation stay the same I may have to keep this going the rest of the season.
Best ever in Spokane?
West Coast                W-L   Pace    PPP   Opp. PPP    EM
1.  Gonzaga              10-0   64.7    1.20    0.93    +0.27
2.  BYU                   7-4   70.4    1.17    1.03    +0.14
3.  Saint Mary's          9-2   60.9    1.10    1.00    +0.10
4.  Pepperdine            7-4   61.7    1.03    0.99    +0.04
5.  San Diego             5-6   63.6    0.95    0.97    -0.02
6.  Portland              3-7   66.8    1.04    1.12    -0.08
7.  San Francisco         3-8   65.9    1.03    1.12    -0.09
8.  Loyola Marymount      3-8   59.7    1.05    1.17    -0.12
9.  Pacific               2-9   60.8    1.00    1.12    -0.12
10. Santa Clara           5-6   59.8    1.00    1.12    -0.12

AVG.                            63.8    1.06
Here is your handy table of how mighty past Gonzaga teams have been over the last five years, relative to this season’s remorselessly accurate bunch.
Highest Gonzaga efficiency margins in WCC play
                    EM
2013              +0.30
2015              +0.27
2010              +0.18
2014              +0.17
2011              +0.17
2012              +0.16
Just to touch some familiar bases here, no, Gonzaga hasn’t done much in the tournament since reaching the 2009 Sweet 16 (or, depending on your standards, since making the 1999 Elite Eight). Yes, the Bulldogs surely will equal or even better that performance one of these years if they keep cranking out teams this good. In their respective days Mike Krzyzewski, Bill Self and John Calipari were all written off as guys who most assuredly couldn’t win the big one. Then they won the big one.
