
A low-fumble group.
Warren Sharp’s analysis of the low fumble rates recorded by New England since 2007 immediately made me wonder how unusual the Patriots’ numbers really are. And by “really,” I of course mean “in college basketball terms.”
Using our old friend Mr. Standard Deviation, let’s frame this question in a way that anyone who follows our nation’s True Greatest Sport can understand. Here are a few of the more statistically aberrant team-based behaviors currently occurring in college hoops:
                                  SD's better/worse (-)
                                       than mean
Utah efficiency margin                    1.95
Richmond offensive rebound %             -2.31
Arizona defensive rebound %               2.34
Kentucky defense                          2.44
Wisconsin turnover %                      2.46
Kentucky efficiency margin                2.53
San Diego opp. turnover %                 2.54
Wichita State turnover %                  2.59
San Jose State offense                   -2.61
Virginia defense                          2.62
Wisconsin offense                         2.63

Patriot fumble rate, 2010-14              3.83

Basketball stats: Relative to respective conference means, conference games only
Football stat: Relative to NFL mean (offensive plays per fumble lost, all games)
“Tuesday Truths” has been one of our country’s most cherished traditions since the Taft administration, and in that time I’ve never seen a team statistic vary from its league mean by three standard deviations, much less close to four. I don’t suppose there’s a single correct conclusion to be drawn from that observation — mundane circumstances produce statistically zany outcomes once in a great while. But put me down as one vote for “the most statistically extreme thing I’ve yet run across.”
Welcome to Tuesday Truths, where I look at how well 131 teams in the nation’s top 11 conferences are doing against their league opponents on a per-possession basis.
Considerably fewer than 1K late-arriving words on Coach K
Through games of January 26, conference games only
Pace: possessions per 40 minutes
PPP: points per possession Opp. PPP: opponent PPP
EM: efficiency margin (PPP – Opp. PPP)
ACC                       W-L   Pace    PPP   Opp. PPP    EM
1.  Virginia              7-0   56.0    1.11    0.87    +0.24
2.  North Carolina        7-1   68.3    1.14    1.01    +0.13
3.  Notre Dame            7-1   61.2    1.16    1.05    +0.11
4.  Louisville            4-2   64.7    1.09    1.01    +0.08
5.  Duke                  4-2   67.3    1.11    1.04    +0.07
6.  NC State              4-4   64.4    1.10    1.03    +0.07
7.  Miami                 4-2   63.6    1.09    1.05    +0.04
8.  Syracuse              5-3   65.4    1.01    1.01     0.00
9.  Clemson               3-4   59.8    0.94    1.02    -0.08
10. Wake Forest           1-6   70.1    0.99    1.08    -0.09
11. Pitt                  3-4   60.5    1.04    1.13    -0.09
12. Florida State         2-5   64.6    1.03    1.12    -0.09
13. Georgia Tech          0-7   60.2    0.93    1.05    -0.12
14. Boston College        1-5   60.1    0.96    1.09    -0.13
15. Virginia Tech         0-6   64.2    0.94    1.13    -0.19

AVG.                            63.4    1.04
I’ve alluded to this quality of Mike Krzyzewski’s before, but on the occasion of the Duke head coach recording career win No. 1000 allow me to salute his ability to thrive as what might be termed a discriminating “cafeteria consumer” at the Bob Knight buffet of coaching influence.

Pictured: 1,902 wins. Two spiffy white shoes.
Knight was one of the most decorated coaches in Division I history, yet his influence has, if anything, extended far beyond his success. Arriving in the Big Ten at a time when teams often scored more than 100 points, Knight famously employed a studiously patient motion offense and dogged man-to-man defense. It worked, to the tune of three national titles within a span of 12 seasons. He “changed the formula,” as Gene Keady has put it succinctly.
Many coaches chose — and to this day some still choose — to duplicate this playbook unquestioningly and in toto. And certainly few figures would have been in a better position to do so than Krzyzewski, a native Chicagoan who both played for and coached under Knight. It would have been the easiest thing imaginable for Coach K to go full-Knight in substance, scheme, and manner.
Instead he borrowed what he could use from Knight, drew upon what other coaches had to offer, and came up with the rest on his own. That’s what makes Krzyzewski’s widely praised flexibility (he played zone!) more impressive than it otherwise would be. He refused to copy the most copied coach of our era even though he was in the best position to do so. And that refusal enabled him to eclipse Knight’s win total.
Salute.
Georgia Tech is the ACC Northwestern. The Big Ten university located in Evanston, Illinois, has a pretty fair journalism program, so by now you’ve heard all about how unlucky Chris Collins’ Wildcats have been. But who will speak for a bunch of engineers in Atlanta? Their methodical task-oriented voices cry out to be heard, and (engineers will appreciate this) statistically speaking Brian Gregory’s Yellow Jackets are indeed Northwestern South. Based on their performance on a possession-by-possession basis, each of these teams “should” have one additional conference win over and above what the hoops gods have seen fit to grant them. Grieve for both.
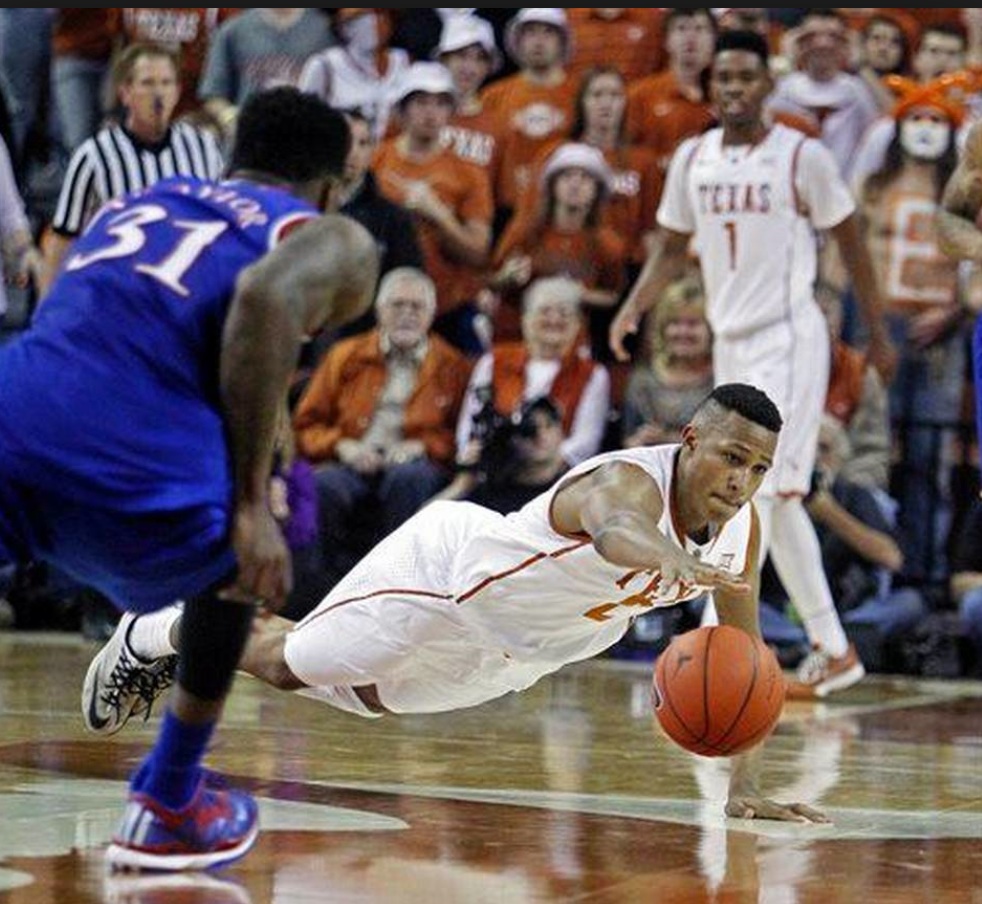
Personally I don’t discern a big-D Decline in college hoops, but if you do blame the Big 12
Big 12                    W-L   Pace    PPP   Opp. PPP    EM
1.  Kansas                5-1   67.8    1.11    0.96    +0.15
2.  West Virginia         4-2   72.9    1.03    0.99    +0.04
3.  Iowa State            5-2   70.0    1.09    1.07    +0.02
4.  Kansas State          5-2   59.5    1.01    0.99    +0.02
5.  Baylor                3-3   60.8    1.04    1.03    +0.01
6.  Oklahoma State        3-4   63.3    0.97    0.96    +0.01
7.  Texas                 3-4   65.6    1.02    1.01    +0.01
8.  Oklahoma              3-4   67.4    1.02    1.01    +0.01
9.  TCU                   1-5   64.7    0.94    1.00    -0.06
10. Texas Tech            1-6   64.4    0.88    1.09    -0.21

AVG.                            65.6    1.01
Unwatchable? (kansascity.com)
Kansas apparently made bulletin-board material of all that title-streak-in-peril talk, because even pre-Super Bowl the Jayhawks already look beautiful both in the standings and in the Truths. I saluted KU in that vein on Sunday.
I trust there will be time enough this season to limn Cliff “Sir Dunksalot” Alexander and the guys more extensively, so today I want to flag a point with regard to the Big 12 as a whole. This league’s going to hell in a hand basket.
In theory. You have heard and will continue to hear it said that scoring is “down” in college basketball this season. True enough, and in fact scoring has downright plunged in the Big 12 in particular….
            Points per 40 minutes
            2014   2015    change
Big 12      71.9   66.3    -7.9%
Pac-12      69.7   66.4    -4.7%
Big East    69.4   66.4    -4.5%
SEC         68.2   65.5    -4.0%
Big Ten     66.6   65.2    -2.0%
ACC         64.9   65.9    +1.6%

Average     68.5   65.9    -3.7%

Conference games only
What is it about major-conference basketball that’s changed from year to year, pace or offensive efficiency? Mostly the latter (down 2.2 percent), but there is also some of the former at work here (1.5 percent slower than the good old days a few months ago). Put those two factors together and scoring is indeed down a little in the major conferences and rather a lot in the Big 12.
But no one’s really complaining about the Big 12’s plunge in scoring, and I suppose in a nutshell that’s my whole problem with the Decline school of thought. Players aren’t transferring a la Iowa in 2009, gate receipts and TV ratings aren’t in a tailspin, and the league commissioner isn’t convening any blue-ribbon panels.
Why is that? No one knows. Maybe there’s a range of scoring values within which aesthetically pleasing basketball can take place, and we’re Declining comfortably within that capacious safe-zone all this while. Whatever the reason, this scoring-blighted conference is being praised — correctly — as the strongest conference in the country from top to bottom. (Though that “nine Big 12 teams have been ranked at some point this season” statement seems like a pallid bid to derive prestige from error. Just because a critical mass of pollsters was at one time mistaken enough to rank TCU doesn’t say anything descriptive in particular about Division I’s strongest league.)
In any event when you see the “scoring is down” claim being restated, just remember there’s a David Ogilvy drunk-and-lamp-post dynamic at work here. The numbers are likely being drafted into duty more for support than illumination.
Apparently Roosevelt Jones’ importance is near-McDermottian
Big East                  W-L   Pace    PPP   Opp. PPP    EM
1.  Villanova             5-2   65.2    1.11    0.99    +0.12
2.  Georgetown            6-2   62.7    1.09    1.01    +0.08
3.  Butler                5-3   64.5    1.06    1.02    +0.04
4.  Xavier                4-4   64.5    1.10    1.07    +0.03
5.  Providence            5-2   63.3    1.02    1.00    +0.02
6.  DePaul                5-3   66.5    1.03    1.05    -0.02
7.  Marquette             2-5   63.5    0.98    1.02    -0.04
8.  Seton Hall            3-4   62.5    1.02    1.07    -0.05
9.  St. John's            2-4   64.7    1.06    1.11    -0.05
10. Creighton             0-8   61.5    0.95    1.10    -0.15

AVG.                            63.8    1.04
Butler has already won more Big East games than it did all of last season, and my colleague Joe Lunardi is currently projecting the Bulldogs as a No. 6 seed. That’s a speedy turnaround for a program that until very recently seemed locked into a dispiriting post-Stevens mediocrity spiral. (Perhaps at root it was really a dispiriting post-Cannon mediocrity spiral. Either way, it wasn’t pretty.)
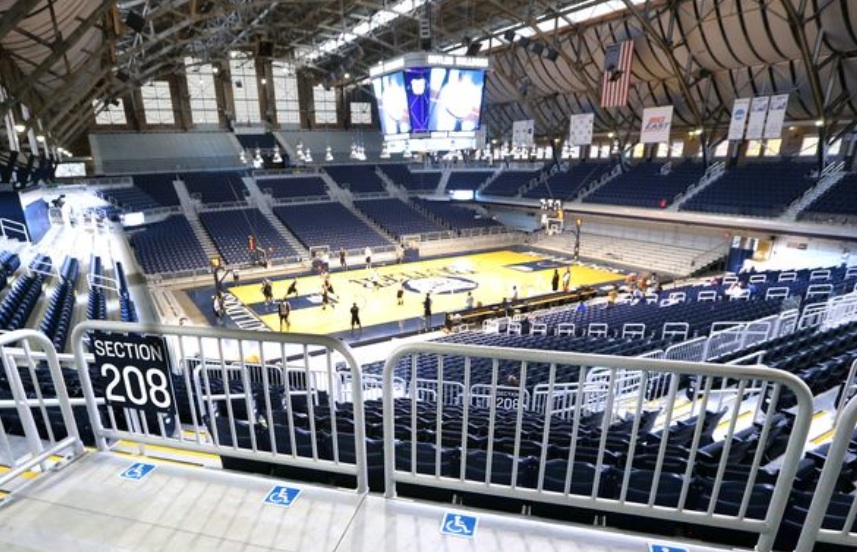
Newly renovated Hinkle looks spiffy. (indystar.com)
Of course Roosevelt Jones missed all of last season with a wrist injury, so one possibility is that it’s his return that has spurred this 180. I’ll buy that: Jones’ presence has taken an enormous weight of off Kellen Dunham’s shoulders, and as a result the junior now uses fewer possessions and misses way fewer shots.
That being said, even with a less burdened new-look Dunham the Bulldogs as a team aren’t what you’d call the last word in accuracy. Take it away, Chris Holtmann: “We tend to miss a lot of shots, so we have a chance to get a lot of rebounds.”
He’s only half-joking. Butler really is semi-hapless from the field, having made just 44 percent of its 2s in conference play. But just like the coach says, BU’s been pulling down 35 percent of its misses (No. 2 in Big East play) while also preventing opponents from doing likewise (No. 1 in defensive rebounding at 73.5 percent). And with the single exception of Kameron Woods on the defensive glass, the cool thing is there are no outstanding individual rebounders on this roster. Beastly dual-directional rebounding is a group effort in Naptown, and it comprises the largest single year-to-year difference in the Bulldogs’ performance.
With luck there will be zero Butler players on the All-Big-East team (that certainly looks like a good bet right now), and the evergreen team-versus-talent point will thus be made anew. In the meantime I hereby proclaim Holtmann a regular lil’ Izzo, one who has hit the ground rebounding.
Last week I saw the future of offense, and its name is Bo Ryan
Big Ten                   W-L   Pace    PPP   Opp. PPP    EM
1.  Wisconsin             6-1   57.2    1.26    1.03    +0.23
2.  Ohio State            5-3   63.2    1.11    1.05    +0.06
3.  Michigan State        4-3   63.5    1.06    1.00    +0.06
4.  Maryland              6-2   65.8    1.01    0.97    +0.04
5.  Indiana               5-2   65.3    1.10    1.09    +0.01
6.  Purdue                4-3   62.9    1.02    1.02     0.00
7.  Nebraska              4-3   62.5    0.98    0.98     0.00
8.  Michigan              5-3   59.5    0.99    1.00    -0.01
9.  Minnesota             2-6   65.2    1.03    1.05    -0.02
10. Penn State            1-6   63.9    1.03    1.07    -0.04
11. Illinois              3-5   63.7    1.00    1.05    -0.05
12. Iowa                  4-3   60.6    1.10    1.16    -0.06
13. Northwestern          1-6   61.3    1.01    1.09    -0.08
14. Rutgers               2-6   62.9    0.91    1.03    -0.12

AVG.                            62.7    1.04
(With apologies to Jon Landau.)
I really, really wish Adam Woodbury hadn’t poked Nigel Hayes and Frank Kaminsky’s eyes in Iowa’s 82-50 loss to Wisconsin in Madison last week. (Inadvertently or otherwise.) If he hadn’t maybe we would have paid more attention to the fact that the Badgers managed to score 82 points in a 54-possession contest. This eruption constitutes what as of three minutes ago I like to term an Extreme Scoring Event.
Listed here are some renowned or merely recent ESEs that came to mind just off the top off my head. (Don’t just mutter ineffectually; send me more from the Tuesday Truths membership. Must be north of 1.40 to play this game.)
Team             Date       Opponent         Pts   Poss   eFG%   PPP
Ohio State       03/06/11   Wisconsin         93    58    83.0   1.61
Colorado State   01/14/15   Nevada            98    62    66.9   1.57
Colorado State   12/19/14   Denver            85    55    67.0   1.53
Denver           12/19/14   Colorado State    84    55    74.5   1.52
Wisconsin        01/20/15   Iowa              82    54    56.8   1.52
Gonzaga          01/24/15   Pacific           91    62    70.0   1.48
You get the idea. To capture the ESE lightning in a bottle it really helps to shoot completely and totally out of your mind. Four years ago Jon Diebler-era Ohio State scored an unthinkable 1.61 points per trip against the Badgers because the Buckeyes made 14 threes in a row.
But look at Wisconsin’s ESE against the Hawkeyes. My perspicacious and indefatigable colleague Eamonn Brennan was all over what was weird even in his reaction piece filed that very night:
Bo Ryan’s team was about as close to perfect on the offensive end as a college basketball team can be, and in the most impressive, least flukey sense of the phrase….And how? Not because Wisconsin had some impossibly torrid shooting performance.
In fact the game against Iowa ranked as nothing more out of the ordinary than Wisconsin’s fourth-best shooting performance in conference play. Shooting runs hot and cold even with the best offenses, but turnover-avoidance and crashing the offensive glass can pay reliable dividends.
Now, obviously committing just one turnover in a game — even if it’s the Badgers we’re talking about — is itself a fluke, but extreme cases make teachable examples. For 40 instructive minutes when they weren’t being poked in the eyes, the Badgers got inside the hoops machine and shone a light on how powerful mere shot attempts really can be in bulk: Wisconsin recorded the one turnover and also rebounded 47 percent of its misses against Iowa.
The way to get more shot attempts is to take care of the rock and (superstition be damned) crash your offensive glass. When a coach espouses this and pursues it with not only with a grim sense of purpose but also — and far more importantly — 85th percentile talent or better, the fusion thus achieved will be the hoops Elvis. Maybe. In any event, More Shots is a banner worth flying on a trial basis.
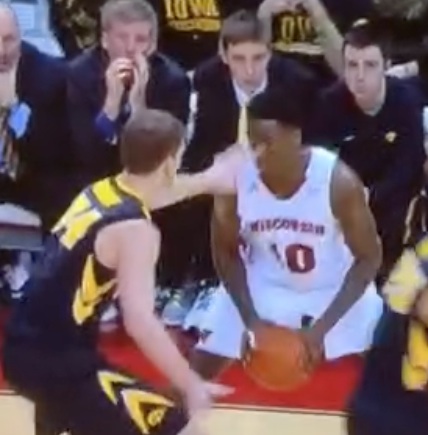
Did Dakich voice an opinion on this whole deal? I didn’t notice.
Eyepokegate, we hardly knew ye: As seen in the numbers above, the Iowa defense has indeed been terrible in Big Ten play. Part of that’s simply the luck of the bookkeeping draw — that historic eruption by the Wisconsin offense has to land on someone‘s ledger — but do keep in mind this performance comes just one year after a total defensive collapse down the stretch cost the Hawkeyes a once-promising season. Short of poking opponents in the eyes inadvertently or otherwise, Fran McCaffery’s men will want to try something different than what they’ve been doing on that side of the ball.
We will all toil in Utah’s underground sugar caves
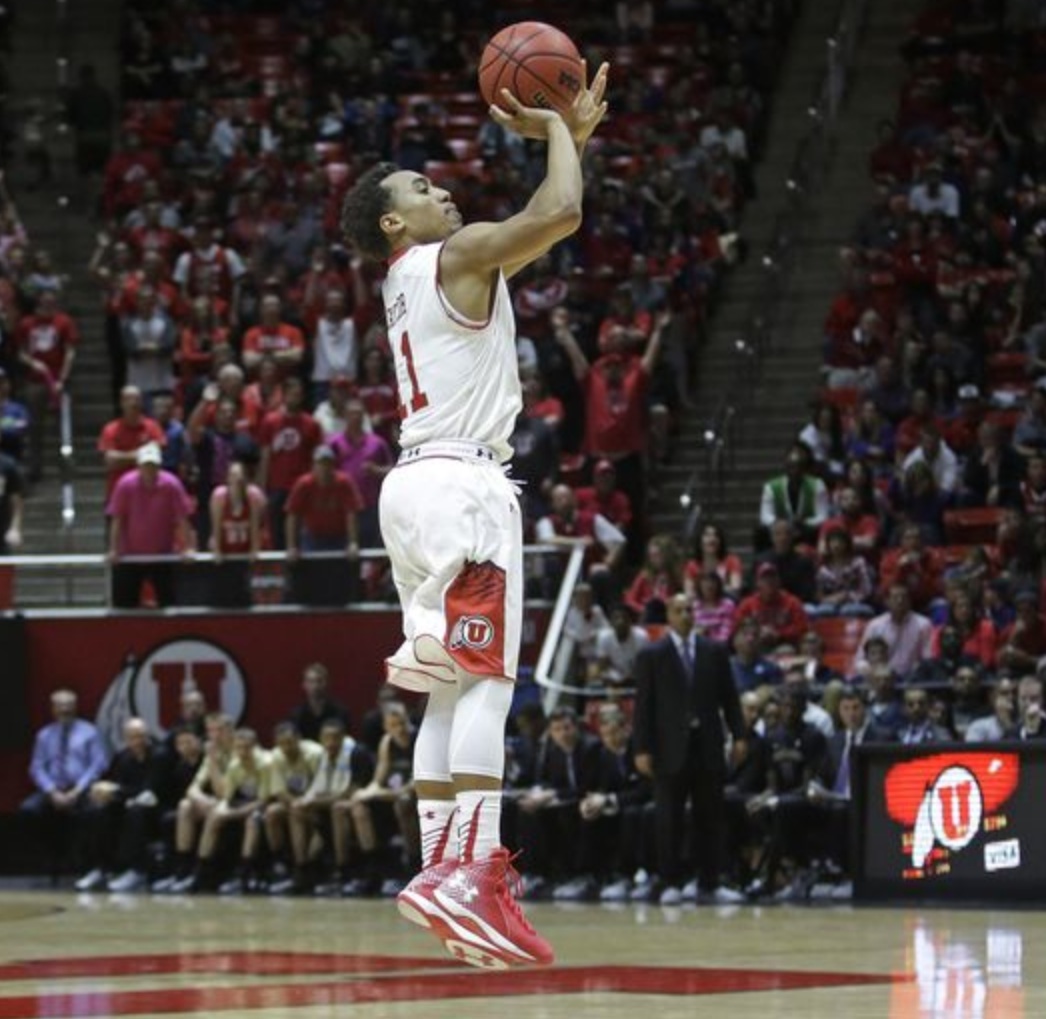
Delon who? In Pac-12 play Brandon Taylor’s shooting 62 percent on his threes. (AP)
Pac-12                    W-L   Pace    PPP   Opp. PPP    EM
1.  Utah                  6-1   61.4    1.20    0.91    +0.29
2.  Arizona               6-1   64.5    1.13    0.90    +0.23
3.  Stanford              5-2   65.6    1.11    1.03    +0.08
4.  Oregon State          5-2   59.3    0.97    0.93    +0.04
5.  Colorado              3-4   65.7    1.01    0.98    +0.03
6.  Oregon                4-3   68.1    1.08    1.07    +0.01
7.  Washington            3-4   64.3    1.01    1.04    -0.03
8.  UCLA                  3-4   64.2    0.98    1.04    -0.06
9.  Arizona State         2-5   65.0    0.96    1.03    -0.07
10. USC                   1-6   68.2    0.95    1.08    -0.13
11. Washington State      3-4   67.6    1.00    1.14    -0.14
12. Cal                   1-6   67.3    0.87    1.08    -0.21

AVG.                            65.1    1.02
Salute the Utes. Larry Krystkowiak’s bunch sports the highest number for per-possession scoring margin to be found anywhere within the vast and variegated Tuesday Truths landscape. When there’s a “+0.29” next to your name this close to February, you’re doing something right.
Yes, that number’s about to go down. Delon Wright, Brandon Taylor, Jakob Poeltl and the gang will play five of their next seven games on the road, and regardless of the venue it’s probable that we will soon be speaking of Utah’s in-conference 46 percent three-point shooting in the past tense. (So by all means let’s seize this moment and note that in Pac-12 play Utah’s been more accurate from beyond the arc than Cal, UCLA, Oregon State, and Colorado have been inside it. See what I mean? Feisty Utes.)
Of course you can slice a healthy chunk out of Utah’s current scoring margin and still be looking at the best team not named “Arizona” that’s ever come out of the Pac-12. (“Ever” as in “the league’s in its fourth year, and in season one it was historically weak.”) Meantime enjoy the visual delights of a perimeter-oriented team that’s hitting threes at an insane rate. Utah is Indiana, only with defense.
There seems to be a perception afoot that the Utes are merely the Pac-12 Saint Mary’s, a pretty good team that was completely blown off the floor on the home court of the league’s best team. Maybe that assessment will turn out to be as good as any, or possibly Utah really is Mountain Time Zone Virginia. I’ll keep you posted.
“Great team, dull conference race” may not be just an SEC thing anymore
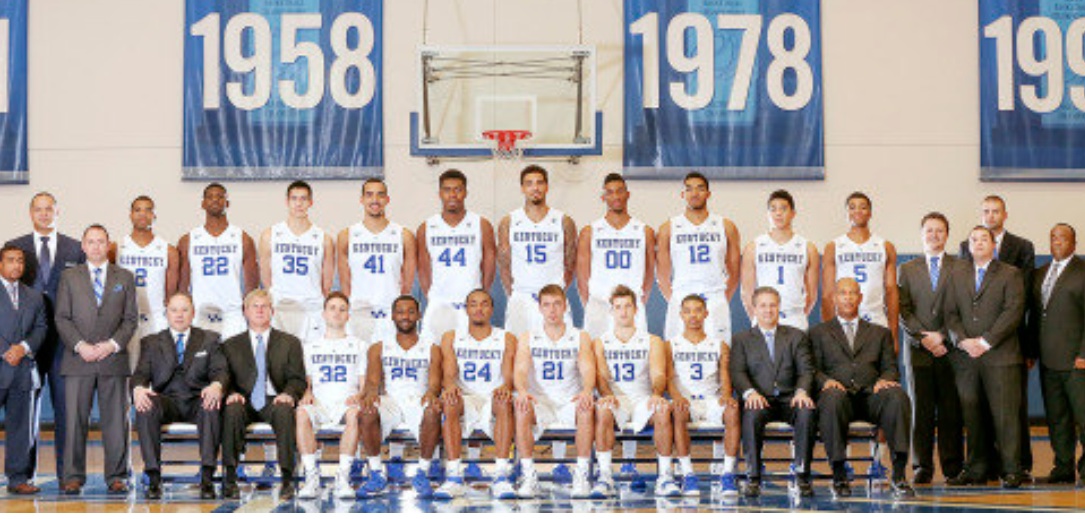
Trend-setters?
SEC                       W-L   Pace    PPP   Opp. PPP    EM
1.  Kentucky              6-0   61.3    1.12    0.86    +0.26
2.  Florida               3-3   64.5    1.06    1.02    +0.04
3.  Georgia               4-2   66.1    1.07    1.03    +0.04
4.  Ole Miss              3-3   67.9    1.09    1.05    +0.04
5.  LSU                   4-2   69.3    1.00    0.96    +0.04
6.  Alabama               3-3   60.6    1.03    0.99    +0.04
7.  Tennessee             4-2   60.7    0.99    0.97    +0.02
8.  Arkansas              4-2   67.7    1.12    1.12     0.00
9.  Texas A&M             4-2   61.4    0.99    0.99     0.00
10. Vanderbilt            1-5   64.9    0.97    1.02    -0.05
11. Auburn                2-4   65.9    0.98    1.07    -0.09
12. Mississippi State     2-4   63.3    0.96    1.06    -0.10
13. South Carolina        1-5   63.3    0.94    1.05    -0.11
14. Missouri              1-5   62.4    0.92    1.10    -0.18

AVG.                            64.2    1.02
This week the question was posed whether it’s better for a great team to be challenged by other formidable rivals in league play or whether all in all it might not be preferable to coast with relative ease into the postseason. That is one timely question.
In 2015 we see no shortage of teams at serious risk of coasting. In fact it’s easier to name the exceptions: Villanova looks like it’ll have to fight off half the Big East to defend that title, and — see above — Utah may remain rather impolitely in the way of any coasting plans that Arizona may have once cherished.
And that’s about it. On the flip side of that coin Kentucky, Virginia, Kansas, Wisconsin, Wichita State, and Gonzaga have all been significantly better on each possession than any of their league rivals to this point in the season. Of course the Jayhawks and Badgers have already blown any shot at running the table in-conference, and in the ACC the always popular “Virginia won’t be able to keep this up” vigil is now in its second year. So let’s trot out the caveats….
It’s January, and plenty of time remains for teams to rise, fall and run in place. Some teams will do all of the above. But thus far there’s been an unusual amount of performance distance recorded between the respective first and second place teams across the Tuesday Truths leagues. Kentucky’s membership in the SEC — where the Wildcats are fully 0.22 points per possession better than the league’s next-best team — is the most extreme example of this dynamic but not the only one.
Conference hegemony as handy screening device. Take our list of teams currently outperforming their leagues by a goodly margin, toss in the two worthy rivals from the top of the Pac-12, and I’ll even let you add a second ACC team of your choosing. There. That may turn out to be a serviceable short list of national championship contenders. Hold that thought.
Frank Haith is the master of rookie seasons
American                  W-L   Pace    PPP   Opp. PPP    EM
1.  SMU                   7-1   61.7    1.13    0.90    +0.23
2.  Tulsa                 7-0   64.4    1.05    0.89    +0.16
3.  Cincinnati            5-2   59.9    1.04    0.90    +0.14
4.  Connecticut           4-2   60.4    0.98    0.91    +0.07
5.  Memphis               5-3   65.7    1.02    0.96    +0.06
6.  Temple                4-3   66.0    0.94    0.94     0.00
7.  Tulane                4-4   60.8    1.02    1.03    -0.01
8.  UCF                   2-6   63.9    1.03    1.12    -0.09
9.  East Carolina         1-5   60.5    0.94    1.10    -0.16
10. Houston               0-8   63.0    0.92    1.11    -0.19
11. South Florida         1-6   60.9    0.83    1.06    -0.23

AVG.                            62.5    0.99
Tulsa has been playing outstanding defense to this point in the American season, and indeed Cincinnati may have to consider filing a lawsuit for patent infringement. Like the Bearcats of yore, Frank Haith’s youngsters combine average shooting or worse with a compensatory ability to prevent opponents from scoring.
We should have seen it coming. When first-year Golden Hurricane coach Frank Haith took the Missouri job in 2011-12, the Tigers had a season for the ages. Powered by an offense that terrorized opponents on the school’s way out the Big 12 door, Mizzou earned a No. 2 seed only to fall in the round of 64 to Norfolk State.
Give Haith credit, he knows well enough to let veteran players do what they do best. Haith inherited Shaquille Harrison, James Woodard, Rashad Smith, and Rashad Ray from previous coach Danny Manning, and the Tulsa D is once again excellent. (Though at some point American opponents may well begin hitting better than 25 percent of their threes against the Hurricane.) If coaches were required to rotate jobs each season, Haith would be a colossus.
One additional point just to keep our Cincinnati cliches straight. Let the record show that interim UC coach Larry Davis has his young guys playing D and hitting shots this season. As I’ve noted before, if the Bearcats can just manage to hold on to the rock, this is a good team.
Larry Shyatt has nothing whatever to do with the A-10, but I still owe him an apology
A-10                      W-L   Pace    PPP   Opp. PPP    EM
1.  Dayton                6-1   61.9    1.11    0.94    +0.17
2.  VCU                   6-0   70.2    1.03    0.91    +0.12
3.  Davidson              5-2   64.1    1.15    1.04    +0.11
4.  George Washington     6-1   60.5    1.09    0.99    +0.10
5.  Richmond              3-3   60.3    1.12    1.02    +0.10
6.  Rhode Island          5-2   65.1    0.93    0.87    +0.06
7.  St. Bonaventure       4-3   63.1    1.03    1.02    +0.01
8.  La Salle              2-4   63.2    0.92    0.95    -0.03
9.  UMass                 3-3   64.1    0.97    1.00    -0.03
10. Saint Joseph's        2-4   64.3    1.01    1.05    -0.04
11. George Mason          1-5   62.5    0.99    1.10    -0.11
12. Duquesne              1-6   65.0    1.03    1.15    -0.12
13. Saint Louis           1-5   64.7    0.93    1.09    -0.16
14. Fordham               0-6   67.6    0.85    1.04    -0.19

AVG.                            64.0    1.01
In the preseason I pointed out that last year Wyoming wasn’t very good at offensive rebounding, even though Larry Shyatt’s Cowboys appeared capable enough on the defensive glass. I chalked this discrepancy up to a coach’s preferred style, and I sought to sort out preference from mere inability by looking at the ratio between a team’s offensive rebound rate and its defensive rebound rate. In visually arresting tables I often call that ratio “OR/DR,” and anything in the 20s marks you as exceptionally diffident whenever an offensive rebound is to be had.
If I had waited a little longer I could have found an even better example. As indicated by Richmond’s inclusion at the top of today’s post in a table alongside entities like the Kentucky defense and the Patriots’ fumbles, the Spiders are busy making Wyoming look like North Carolina on the offensive boards.
                     OR%     DR%    OR/DR
Richmond, 2015      14.7    65.3     0.23
Wyoming, 2014       17.3    65.7     0.26

Conference games only
Clearly Richmond is no tower of strength on the defensive glass either, but that percentage has actually stayed relatively stable from year to year while the offensive rebound rate (26.4 in A-10 play last year) has fallen off the table. Maybe this year’s rate will climb as the Spiders put more distance between themselves and their zero-offensive-board showing against George Mason a couple weeks back. Or perhaps Chris Mooney will indeed furnish us an even better example of low-low-offensive-board hoops than Shyatt gave us last season.
Game of the year of the week: George Washington at VCU, Tuesday night. Do the Colonials belong in the conversation with the Rams, Dayton and Davidson? This is Jim Lonergan’s chance to answer in the affirmative.
The Shockers seem under-noticed right now
Missouri Valley           W-L   Pace    PPP   Opp. PPP    EM
1.  Wichita State         8-0   58.5    1.16    0.87    +0.29
2.  Northern Iowa         7-1   55.9    1.07    0.89    +0.18
3.  Illinois State        4-4   63.0    1.06    0.95    +0.11
4.  Indiana State         6-2   63.3    1.06    1.01    +0.05
5.  Evansville            5-3   62.0    0.99    0.98    +0.01
6.  Loyola                3-5   59.4    0.98    1.04    -0.06
7.  Missouri State        2-6   57.6    0.95    1.04    -0.09
8.  Southern Illinois     2-6   60.0    0.91    1.01    -0.10
9.  Bradley               2-6   61.2    0.93    1.04    -0.11
10. Drake                 1-7   57.3    0.89    1.18    -0.29

AVG.                            59.8    1.00
We should remain open to the possibility that Wichita State will turn out to be about as good as last year’s team. Naturally there’s (virtually) no conceivable way in which Gregg Marshall’s team can grab off a No. 1 seed the way it did in the 2014 tournament. (WSU’s currently showing up on the 4 line.) Still, the Shockers are nearing the halfway mark of Valley play looking suspiciously similar to the group we saw last season.
Fred VanVleet continues to look ever more VanVleet-like as the season progresses, and Ron Baker has drained 44 percent of his threes against MVC defenses. Meanwhile no number recorded by any Valley team on either side of the ball is as much of an outlier as Wichita State’s microscopically low turnover rate: 13.5 percent.
That being said, there’s a fair likelihood that this Valley table will not be run this season….
Game of the year, period: Wichita State at Northern Iowa, Saturday afternoon.
Hold all evaluative comments for the time being
Mountain West             W-L   Pace    PPP   Opp. PPP    EM
1.  Colorado State        5-2   64.7    1.14    0.96    +0.18
2.  Boise State           4-3   63.0    1.12    0.98    +0.14
3.  San Diego State       5-2   59.3    1.03    0.90    +0.13
4.  Utah State            4-3   61.6    1.03    0.94    +0.09
5.  Wyoming               6-1   58.1    1.03    0.98    +0.05
6.  New Mexico            5-3   59.8    1.03    0.99    +0.04
7.  UNLV                  2-5   63.3    1.05    1.03    +0.02
8.  Fresno State          5-2   62.5    0.99    0.97    +0.02
9.  Air Force             1-7   60.5    1.02    1.17    -0.15
10. Nevada                2-4   64.0    0.96    1.11    -0.15
11. San Jose State        0-7   62.5    0.75    1.16    -0.41

AVG.                            61.8    1.02
Where the Mountain West and sweeping comparative pronouncements are concerned I move we wait just a little longer, specifically until every team has had the chance to play San Jose State at least once. The teams that have not yet received that statistical benefit are San Diego State, New Mexico, and Nevada.
Meantime congratulations go out to Boise State for jumping from No. 8 to 2 in just seven days.
Statistical extremity is a Spokane tradition
West Coast                W-L   Pace    PPP   Opp. PPP    EM
1.  Gonzaga               9-0   64.9    1.22    0.95    +0.27
2.  Saint Mary's          8-1   63.0    1.07    0.88    +0.19
3.  BYU                   5-4   70.3    1.18    1.05    +0.13
4.  Pepperdine            5-4   62.6    1.04    1.00    +0.04
5.  San Diego             3-6   63.4    0.91    0.96    -0.05
6.  Portland              3-6   67.2    1.07    1.13    -0.06
7.  San Francisco         3-6   64.2    1.05    1.14    -0.09
8.  Santa Clara           5-4   59.5    1.00    1.10    -0.10
9.  Loyola Marymount      2-7   60.8    1.04    1.16    -0.12
10. Pacific               2-7   61.7    1.02    1.14    -0.12

AVG.                            63.8    1.06
In WCC play Przemek Karnowski is making 73 percent of his twos, Kevin Pangos is hitting 52 percent of his threes, and Gonzaga as a team is threatening to post an effective FG percentage north of 60 (currently 59.9). It is all very extreme and very customary.
Mark Few’s team will host Memphis on Saturday evening.
