
They’re getting ready in Indy.
There are at least two problems with focusing on who does and does not get a No. 1 seed. The first problem is that 13 of the last 16 No. 1 seeds have failed to make the Final Four.
The second problem is that this year in particular there will be no meaningful distinction to be drawn on the S-curve between the last No. 1 seed and the first team seeded on the 2-line. In fact in 2015 the number of interest appears to be six, not four. And I’ll go to war with these six: Kentucky, Arizona, Villanova, healthy-Anderson-version Virginia, Wisconsin, and surging Duke.
Sure, other things being equal, it’s best to be a fellow No. 1 seed alongside UK so that you don’t have to face John Calipari’s team until you get to Indy. But this piece of conventional wisdom — trusty enough in its essentials — somewhat overstates the difference between Kentucky and the other five teams named above while also (and we do this one every year) vastly overrating the actual likelihood of a region’s top two seeds meeting up in the Elite Eight.
The probability of a 1 vs. 2 collision in a regional final is 29.3 percent, and while we’re on the topic it’s not terribly clear who should be afraid of whom in such instances. Top seeds are a mere 17-17 in such games. My recommendation is to look past the question of who receives the four No. 1 seeds. Keep your eye on the Big Six instead.
—
Welcome to the season’s final installment of Tuesday Truths, where I look at how well 131 teams in the nation’s top 11 conferences did against their league opponents on a per-possession basis.
Virginia’s more than the sum of its parts, and it really needs one of its parts back
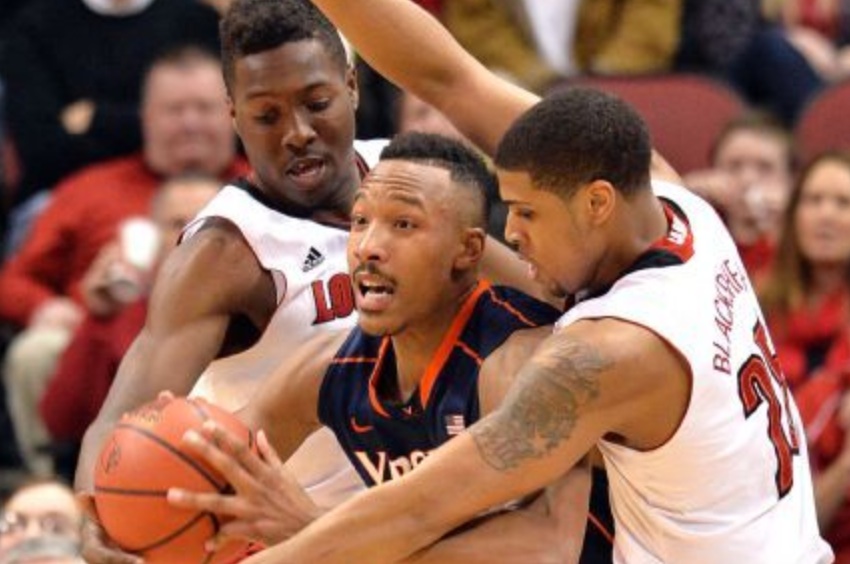
Without Justin Anderson, UVa’s offense has occasionally been stymied. (AP/Timothy D. Easley)
Final results, conference games only
Pace: possessions per 40 minutes
PPP: points per possession Opp. PPP: opponent PPP
EM: efficiency margin (PPP – Opp. PPP)
ACC                       W-L   Pace    PPP   Opp. PPP    EM
1.  Virginia             16-2   57.4    1.07    0.89    +0.18
2.  Duke                 15-3   66.4    1.17    1.03    +0.14
3.  North Carolina       11-7   67.7    1.11    1.03    +0.08
4.  Notre Dame           14-4   62.6    1.15    1.07    +0.08
5.  Louisville           12-6   63.2    1.04    0.99    +0.05
6.  NC State             10-8   63.9    1.07    1.02    +0.05
7.  Miami                10-8   61.9    1.07    1.04    +0.03
8.  Syracuse              9-9   65.5    0.99    1.02    -0.03
9.  Clemson              8-10   61.0    0.97    1.01    -0.04
10. Florida State        8-10   63.6    1.00    1.05    -0.05
11. Pitt                 8-10   60.6    1.07    1.12    -0.05
12. Georgia Tech         3-15   62.9    0.94    1.02    -0.08
13. Boston College       4-14   62.2    1.02    1.11    -0.09
14. Wake Forest          5-13   67.3    0.98    1.11    -0.13
15. Virginia Tech        2-16   62.3    0.99    1.15    -0.16

AVG.                            63.2    1.04
(Attention Duke fans: I yammered on rather extensively about your potent offense at Insider on Sunday. Enjoy.)
Virginia has now logged 492 possessions of basketball without Justin Anderson since he fractured a finger against Louisville last month. That’s a fair sample size, and over that stretch Bennett’s men have scored just 1.03 points per trip.
Interestingly the main problem — no, make that the sole problem, and I don’t get to say this much in my line of work — has been turnovers. The Cavaliers are shooting almost exactly as well from the floor with and without their star, and the Hoos are actually getting to the line more often late in the season. But when Anderson was on the floor, this offense was close to Wisconsin-like in its ability to hang on to the rock on more than 87 percent of the team’s offensive possessions. Now UVa is actually worse than (the ACC) average on that front.
It appears that Anderson is more than merely (ha) one of the best players in the ACC. Whether it’s because Anderson’s very presence takes stress off the offense or because his teammates were and continue to be unduly freaked out by his absence, there’s a measurable before-and-after difference on offense.
The latest reports say that it’s still unclear whether Anderson will return from his finger-appendectomy two-fer in time for the ACC tournament. The impact of a single player’s absence tends to be overstated in college hoops, and we should also keep in mind that UVa’s defense has, of course, continued to be superb this whole time. But Anderson’s disappearance at the ACC season’s midway point leaves little doubt that he makes a significant difference for his team.
Projected NCAA bids: Virginia, Duke, Notre Dame, Louisville, North Carolina, NC State.
The only bubble drama here should come from Miami. If the Hurricanes can notch an upset or two in the ACC tournament, they could play themselves into the field of 68.
—
Is “scoring is down” an evaluative trump card? A Big 12 parable….
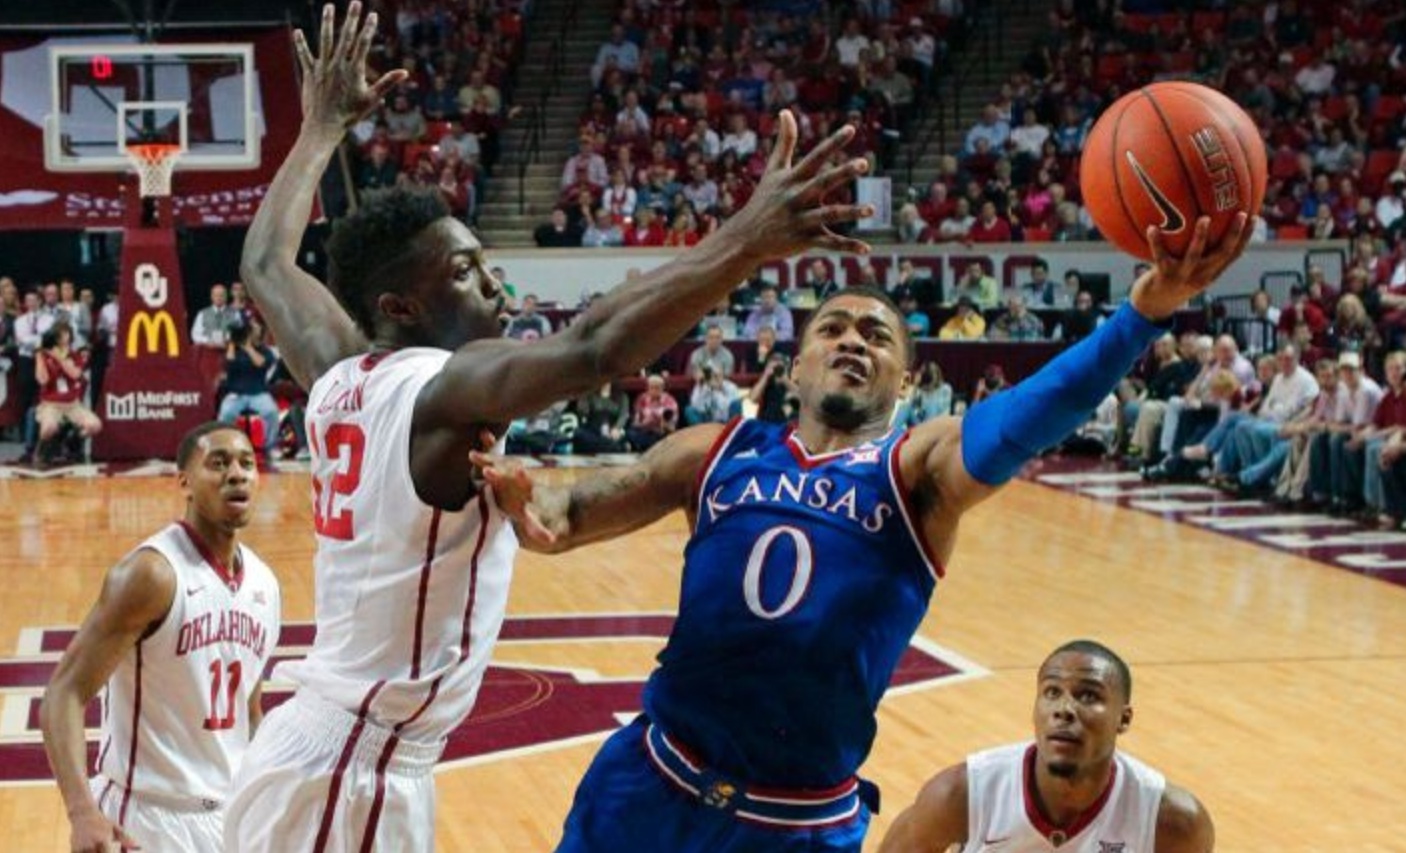
The Big 12 was the best conference in the nation. The Big 12 saw the biggest drop in scoring. Which matters more? (AP/Sue Ogrocki)
Big 12                    W-L   Pace    PPP   Opp. PPP    EM
1.  Kansas               13-5   67.2    1.07    0.97    +0.10
2.  Oklahoma             12-6   66.9    1.05    0.97    +0.08
3.  Baylor               11-7   61.7    1.09    1.01    +0.08
4.  Iowa State           12-6   69.8    1.11    1.04    +0.07
5.  Texas                8-10   62.6    1.02    1.01    +0.01
6.  Oklahoma State       8-10   62.3    1.02    1.02     0.00
7.  West Virginia        11-7   68.6    1.02    1.02     0.00
8.  Kansas State         8-10   61.8    0.95    1.02    -0.07
9.  TCU                  4-14   64.9    0.97    1.05    -0.08
10. Texas Tech           3-15   61.5    0.90    1.11    -0.21

AVG.                            64.8    1.02
The final results are in, and scoring really did decline in major-conference play this season compared to 2013-14.
Regular season’s in the books. Points per 40 min down 3.2% in major-conf play vs. 2014. Biggest drop: Big 12. ACC scoring increased.
— John Gasaway (@JohnGasaway) March 9, 2015
If pure scoring is your criterion of choice, the Big 12 in 2015 suffered a severe double-whammy. No major conference decelerated more.
Changes in pace
Conference games only
                       2014    2015   Change (%)
Big 12                 67.2    64.8     -3.6
Big Ten                64.0    62.3     -2.7
SEC                    65.6    64.1     -2.3
Pac-12                 67.0    65.5     -2.2
Big East               64.9    64.7     -0.3
ACC                    61.8    63.2     +2.3
And no conference suffered a larger year-to-year drop in offensive efficiency (or, if you prefer, registered a bigger improvement in defense).
Points per possession
Conference games only
                       2014    2015   Change (%)
Big 12                 1.07    1.02     -4.7
SEC                    1.04    1.02     -1.9
Big East               1.07    1.05     -1.9
Pac-12                 1.04    1.03     -1.0
ACC                    1.05    1.04     -1.0
Big Ten                1.04    1.04      0.0
Add those two facts together and scoring dropped by more than eight percent in the Big 12 this season, from an average of 71.9 points per 40 minutes in 2014 to 66.1 in 2015.
That’s a significant decrease, but this season I didn’t hear any laments on this front that were specific to the Big 12. Instead I heard it said that the league was the best conference in the nation — which, statistically, it was. Throw a stick at the Big 12 and you’ll hit three or four legitimate NCAA tournament No. 3 seeds.
I for one choose to interpret this scoring-decline/commentariat-praise dichotomy as empirical support for my visually arresting matrix. Give me teams from D-I’s top 10 percent, refs who stay out of the way and March and I’m good.
Projected NCAA bids: Kansas, Iowa State, Oklahoma, Baylor, West Virginia, Oklahoma State, Texas.
Texas? At 8-10 in the Big 12? Right now I’d answer in the affirmative, and as the saying goes the committee has to get to 68 somehow. It’s also true, however, that the Longhorns had the bad luck to draw last-place Texas Tech as their first opponent in the Big 12 tournament. No one, rightly, will care one whit if the Horns win, but a loss there is not recommended.
—
Villanova climbs aboard the #MoreShots bandwagon
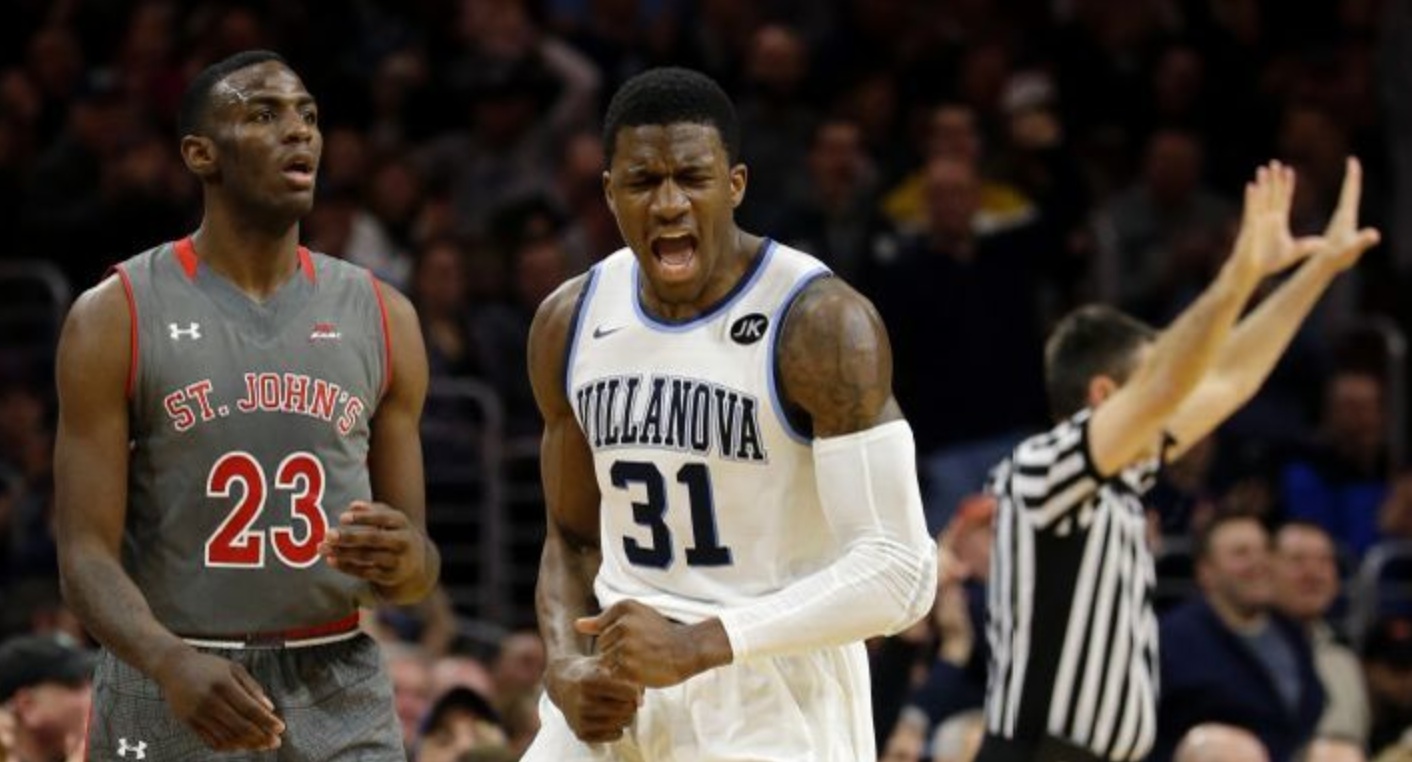
Dylan Ennis is happy about — and Rysheed Jordan is stunned by — the best offensive game recorded by a team in major-conference play this season. (AP/Matt Slocum)
Big East                  W-L   Pace    PPP   Opp. PPP    EM
1.  Villanova            16-2   64.4    1.18    0.98    +0.20
2.  Georgetown           12-6   64.3    1.06    0.99    +0.07
3.  Butler               12-6   63.6    1.07    1.00    +0.07
4.  Xavier                9-9   65.6    1.07    1.04    +0.03
5.  Providence           11-7   65.4    1.06    1.04    +0.02
6.  St. John's           10-8   66.7    1.07    1.09    -0.02
7.  Creighton            4-14   62.6    1.01    1.10    -0.09
8.  Seton Hall           6-12   65.3    1.01    1.10    -0.09
9.  DePaul               6-12   64.9    1.01    1.10    -0.09
10. Marquette            4-14   64.3    0.94    1.05    -0.11

AVG.                            64.7    1.05
This season I’ve been tracking the Wisconsin offense’s heroic feats in maximizing the number of shots it attempts from the field. The Badgers rather famously accomplish this objective through a total ban on turnovers, and when stewardship of the ball is brought together with a few offensive boards the results can be extreme.
Speaking of extreme, Villanova closed the season by scoring 1.55 points per possession at home in a 105-68 win over St. John’s. The Wildcats had actually shot even better from the floor in their previous home game (an 89-61 win over Providence), but the most efficient game of offense recorded by any team in major-conference play this season came about due to a combination of accuracy and volume.
Daniel Ochefu grabbed six offensive boards, and as a team Nova pulled down 42 percent of the available misses. That plus committing just three turnovers will push you into triple-digits in a 68-possession game.
Over the last month of the season this was arguably the best offense in the country: 1.28 points per trip spanning Villanova’s last eight games.
Projected NCAA bids: Villanova, Georgetown, Butler, Providence, St. John’s, Xavier.
No bubble drama here. Keep moving.
—
One last pre-Dance shot at understanding Maryland
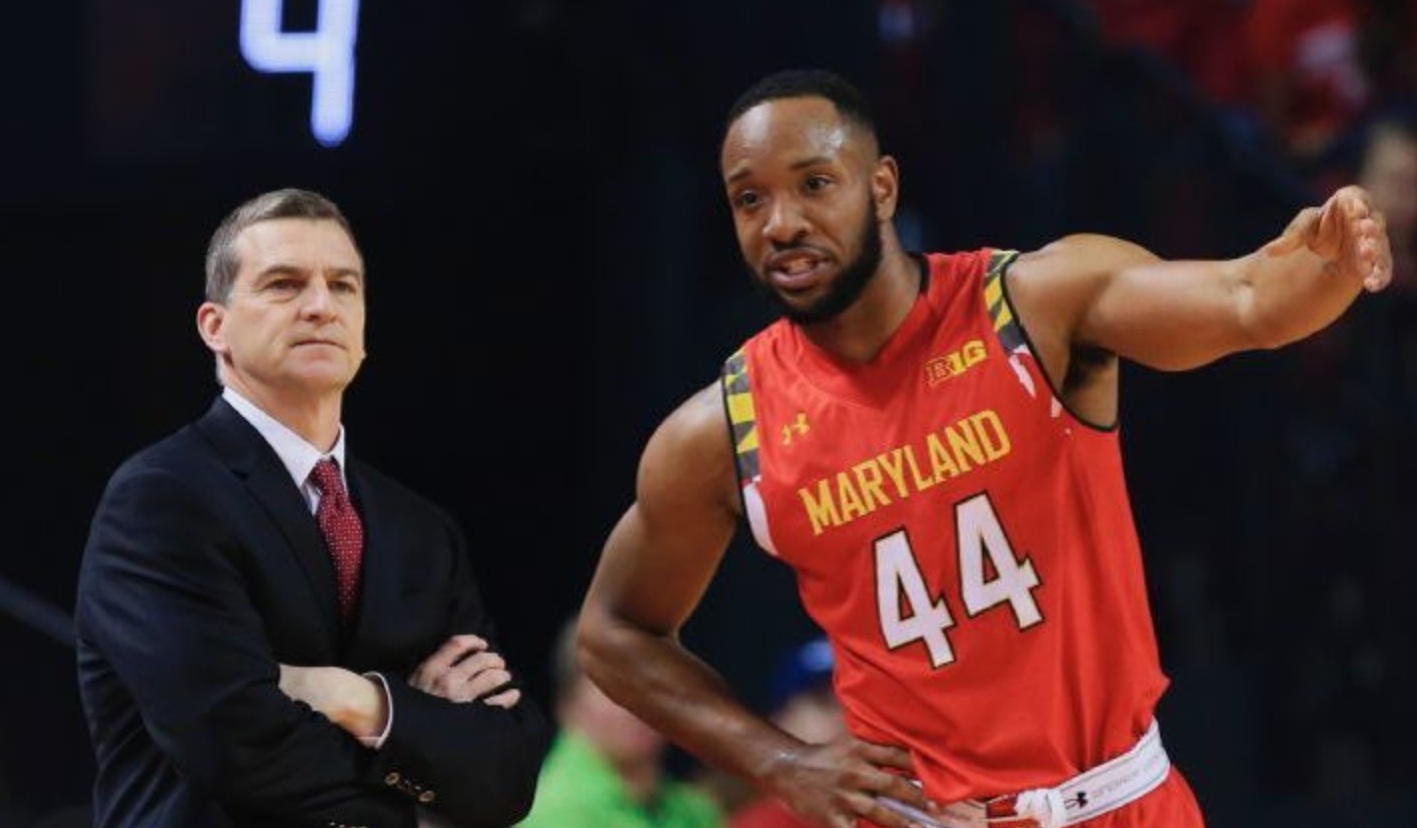
What is it about these guys that makes humans and laptops squabble so? (AP/Nati Harnik)
Big Ten                   W-L   Pace    PPP   Opp. PPP    EM
1.  Wisconsin            16-2   57.5    1.21    1.00    +0.21
2.  Iowa                 12-6   61.3    1.11    1.03    +0.08
3.  Ohio State           11-7   63.5    1.08    1.00    +0.08
4.  Michigan State       12-6   62.2    1.09    1.01    +0.08
5.  Purdue               12-6   63.7    1.04    1.00    +0.04
6.  Maryland             14-4   64.3    1.01    0.99    +0.02
7.  Indiana               9-9   64.7    1.11    1.11     0.00
8.  Illinois              9-9   61.9    1.01    1.01     0.00
9.  Minnesota            6-12   64.3    1.04    1.07    -0.03
10. Michigan             8-10   58.6    1.03    1.07    -0.04
11. Penn State           4-14   64.8    0.97    1.03    -0.06
12. Northwestern         6-12   59.2    1.03    1.12    -0.09
13. Nebraska             5-13   61.6    0.93    1.04    -0.11
14. Rutgers              2-16   64.8    0.90    1.08    -0.18

AVG.                            62.3    1.04
To my eye there were two big stories that emerged from this Big Ten regular season. One, of course, was the dominance of Wisconsin. We’ve seen many great offenses from the Badgers over the last decade, but, for reasons that I set forth with some awe and wonder last week, this one beats them all. Wisconsin this season posted the highest offensive efficiency and recorded the second-best scoring margin (next to Illinois’ +0.24 in 2005) that I’ve ever tracked in the Big Ten. Take a bow, Bo.
The second story comes to us courtesy of the only Big Ten team that beat the Badgers when Frank Kaminsky was in the lineup. That would be Maryland. With my Power Rankings ballot at ESPN this season I tried to strike a proper balance between a bearish Tuesday Truths/KenPom view of the Terrapins on the one hand and the AP pollsters’ more bullish assessment on the other.
Specifically I was willing to give Mark Turgeon’s team a break over and above what the laptops at my place and at Ken’s were so confidently proclaiming, and my willingness was based purely (listen up, Sir Charles) on basketball grounds. I believe it’s a tangible competitive advantage to have not one but two guys — Dez Wells and Melo Trimble — who have set the expectation (far from unique to Wells and Trimble, I need hardly add) that they’ll have a foul called in their favor whenever they drive the ball into the lane and jump directly into the nearest furiously backpedaling defender. Alas my oh so diligent and judicious efforts at balancing have apparently left some observers less than impressed, so let me take another whack at what makes the Terps so divisive to evaluators….
Speaking purely in comparative terms with no dire predictions or negative connotations attached, Maryland stands out. This is true, for example, when we look at every major-conference team that has posted a 14-4 record over the past four years:
14-4 Teams, 2012-15      Year     EM
1.  Florida              2013   +0.28
2.  Louisville           2013   +0.17
3.  Duke                 2013   +0.15
4.  Indiana              2013   +0.15
5.  Kansas               2014   +0.14
6.  Creighton            2014   +0.14
7.  Kansas               2013   +0.14
8.  Georgetown           2013   +0.12
9.  Missouri             2012   +0.11
10. Kansas State         2013   +0.10
11. Marquette            2012   +0.09
12. Notre Dame           2015   +0.08
13. Syracuse             2014   +0.08
14. Marquette            2013   +0.08
15. Washington           2012   +0.07
16. Maryland             2015   +0.02

AVG.                            +0.12
The Terps also stand alone when we look at major-conference teams that have outscored their leagues by 0.02 points per trip over that same time period.
+0.02 Teams, 2012-15     Year     W-L         NCAA seed
1.  Maryland             2015    14-4           (3?)
2.  South Florida        2012    12-6            12
3.  Georgia              2015    11-7           (9?)
4.  Providence           2015    11-7           (6?)
5.  Arizona State        2014    10-8            10
6.  Arkansas             2014    10-8            NIT
7.  Connecticut          2013    10-8            N/A

AVG.                             11-7
True, Maryland will be far from the only outfit in the 2015 NCAA tournament carrying a seed that may not reflect the best assessment of the team’s capabilities. And, anyway, Connecticut won a national title in 2011 after posting an even worse efficiency margin in league play (+0.01). The Terps aren’t doomed, it’s just that for the purposes of filling out your bracket you’ll want to drill down a little deeper than usual with a garden-variety 14-4 Big Ten team on the 3-line.
Projected NCAA bids: Wisconsin, Maryland, Iowa, Michigan State, Ohio State, Purdue, Indiana.
The Hoosiers are showing up on a good many mocks as the last at-large in the field, and Purdue still isn’t what you’d call a stone-cold lock either. IU opens the Big Ten tournament against Northwestern, and if Tom Crean’s men win there they’ll face Maryland. For their part the Boilermakers have been double-byed all the way to Friday afternoon, when they’ll play Iowa, Nebraska or Penn State.
—
(Yes, the Pac-12 is weak. Still….) We will all toil in Arizona’s underground sugar caves
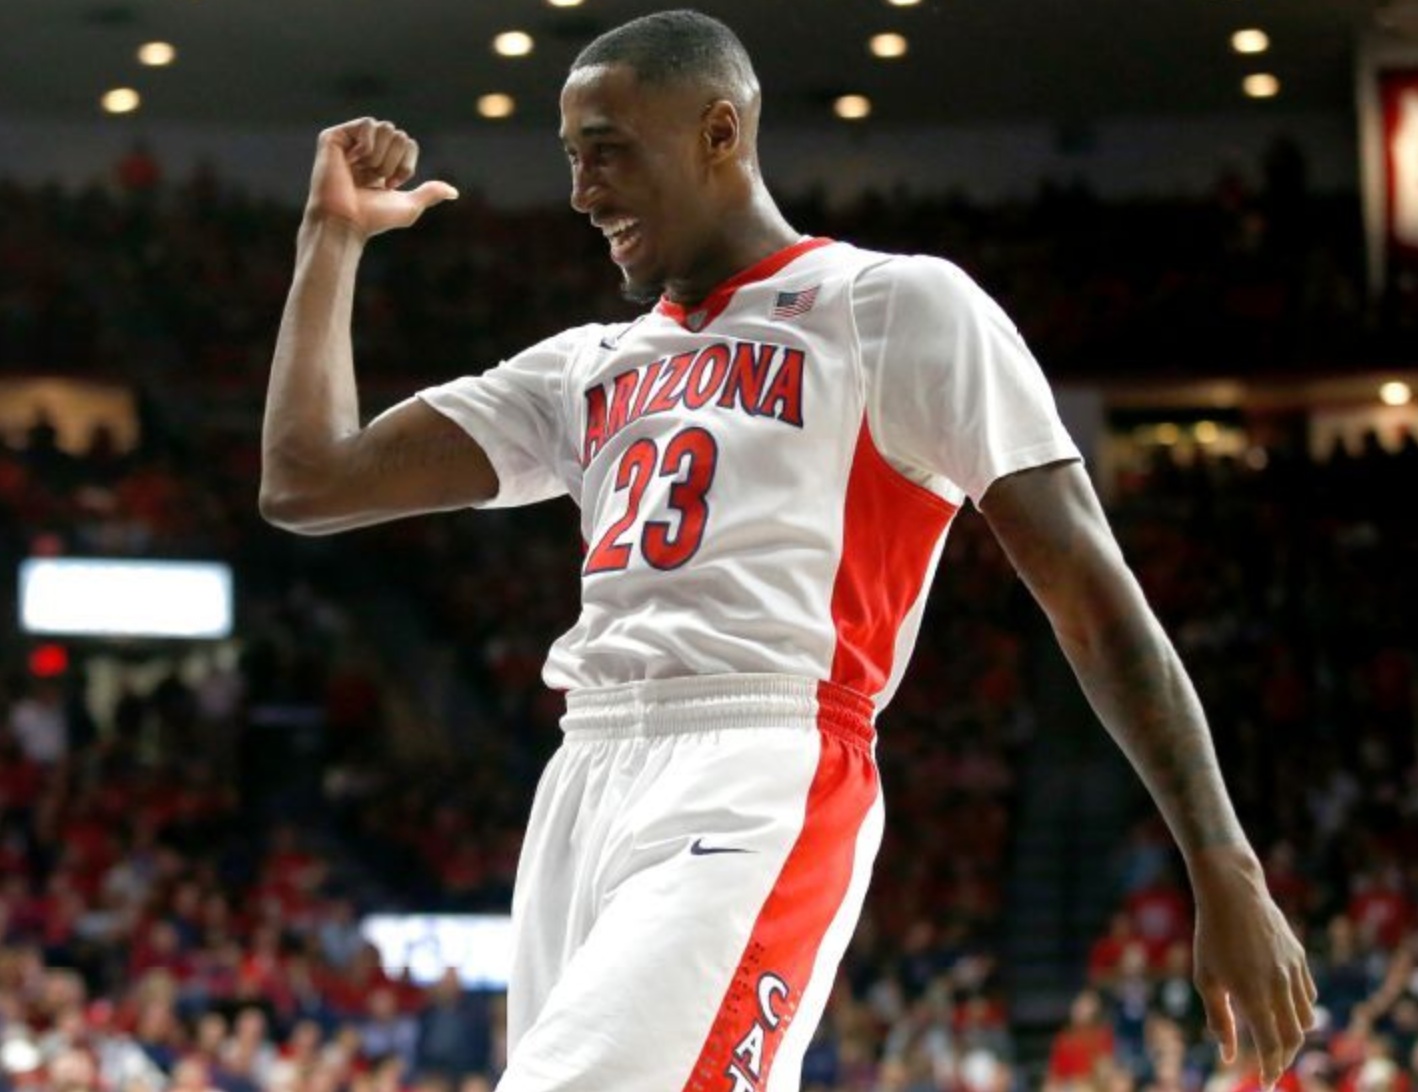
Rondae Hollis-Jefferson’s happy about the best major-conference Tuesday Truths season ever. (AP/Rick Scuteri)
Pac-12                    W-L   Pace    PPP   Opp. PPP    EM
1.  Arizona              16-2   66.6    1.16    0.87    +0.29
2.  Utah                 13-5   61.1    1.14    0.92    +0.22
3.  UCLA                 11-7   64.1    1.05    1.01    +0.04
4.  Stanford              9-9   66.3    1.08    1.04    +0.04
5.  Oregon               13-5   66.6    1.09    1.06    +0.03
6.  Arizona State         9-9   65.7    1.01    1.04    -0.03
7.  Colorado             7-11   66.0    0.99    1.04    -0.05
8.  Oregon State         8-10   61.4    0.90    0.98    -0.08
9.  Washington           5-13   65.4    1.02    1.12    -0.10
10. USC                  3-15   68.7    0.94    1.04    -0.10
11. Washington State     7-11   67.3    1.03    1.14    -0.11
12. Cal                  7-11   67.5    0.97    1.08    -0.11

AVG.                            65.5    1.03
Often this season when I’ve voiced a sentiment to the effect that Arizona plays this sport awfully well, the immediate response directed my way has been a declaration that the Pac-12 isn’t very good.
Of course the Pac-12 isn’t very good. But you know that special evaluative dispensation we bestow annually — and quite correctly — upon Kentucky even though the SEC isn’t very good? That same state of discursive grace needs to be exported to other teams in other leagues.
As it happens the Pac-12 is as strong as the American was last year, and that league cranked out a national champion. And even if that weren’t the case I’m not entirely certain that consorting with the benighted hoops likes of Cal and Washington State is really going to have a measurable effect on Sean Miller’s team next week.
I think one reason that some observers continue to underrate this offense is that the Wildcats get a lot of bang for their scoring buck from 15 feet away with the clock stopped. Note for example that Stanley Johnson does much of his damage from the line. Between Johnson and Karl-Anthony Towns it was a good year for elite freshmen who were weirdly and indeed counter-intuitively accurate on their free throws.
Projected NCAA bids: Arizona, Utah, Oregon.
Stanford’s fall has been swift and severe. Johnny Dawkins’ team is now beneath even UCLA on the mocks, and the Bruins are in “first four out” territory.
—
Kentucky may not be omnipotent, but the Wildcats sure are omnicompetent
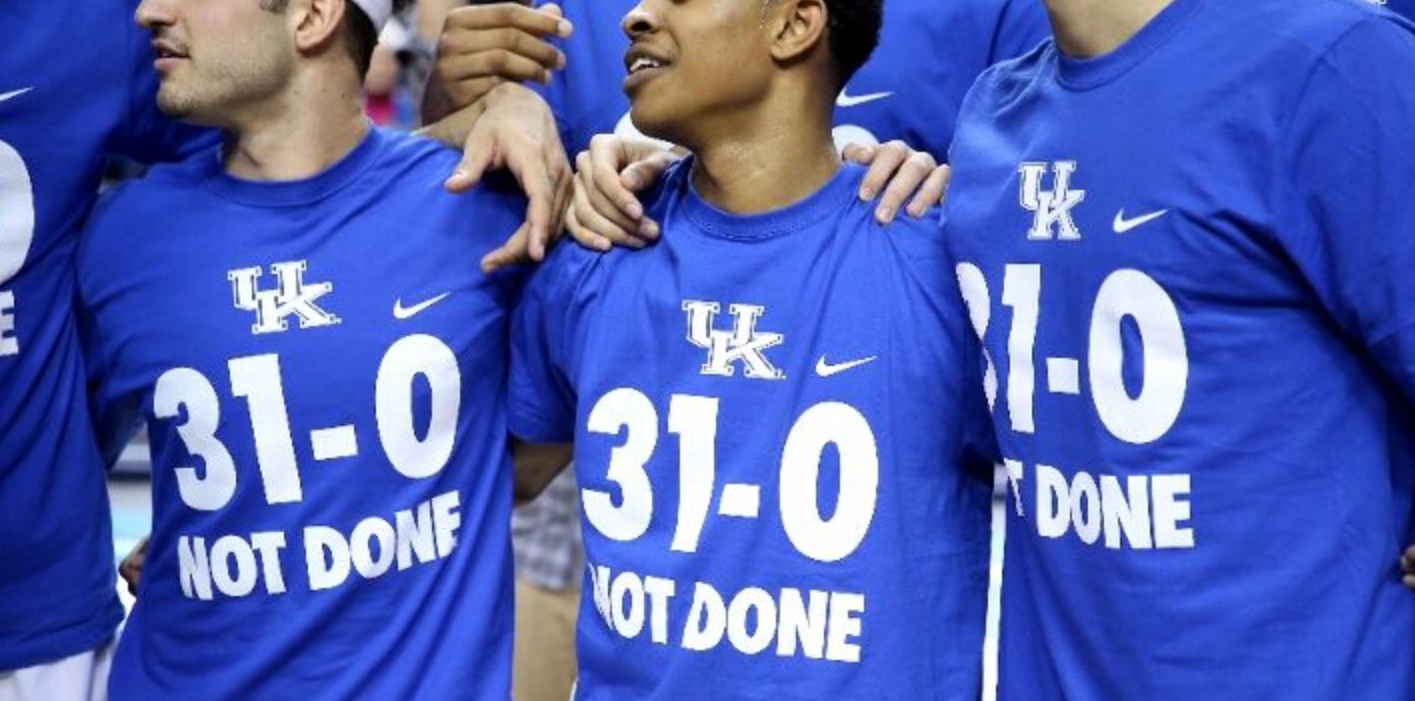
Not done indeed. (Getty/Andy Lyons)
SEC                       W-L   Pace    PPP   Opp. PPP    EM
1.  Kentucky             18-0   62.9    1.15    0.89    +0.26
2.  Arkansas             13-5   69.5    1.07    1.02    +0.05
3.  LSU                  11-7   68.6    1.03    0.98    +0.05
4.  Texas A&M            11-7   62.8    1.03    0.99    +0.04
5.  Ole Miss             11-7   66.0    1.10    1.06    +0.04
6.  Vanderbilt            9-9   62.8    1.06    1.02    +0.04
7.  Georgia              11-7   63.9    1.02    1.00    +0.02
8.  Alabama              8-10   60.7    1.03    1.03     0.00
9.  Florida              8-10   63.3    0.98    0.98     0.00
10. Tennessee            7-11   60.4    1.00    1.05    -0.05
11. South Carolina       6-12   62.5    0.96    1.03    -0.07
12. Mississippi State    6-12   64.6    0.95    1.04    -0.09
13. Auburn               4-14   67.3    1.00    1.13    -0.13
14. Missouri             3-15   62.2    0.92    1.10    -0.18

AVG.                            64.1    1.02
Thank goodness there’s an NCAA tournament, because Kentucky badly needs the competition. The SEC just showed us the largest per-possession scoring margin between a major conference’s Nos. 1 and 2 teams in Tuesday Truths history. And to put that historic gap into contemporary perspective, the difference in performance between UK and Arkansas in SEC play was larger than the one between Kansas and TCU in the Big 12.
Before the season started I suspected that the Wildcats might wreak havoc in two areas in particular — two-point defense and offensive rebounding. That prediction looked really good in December, but in SEC play UK turned out to be merely great and not insane in both categories. Vanderbilt (yes, Vanderbilt) forced misses in the paint about as well as the Wildcats in conference play, and transition-year Tennessee was slightly superior on the offensive glass.
Instead something far more interesting than what I predicted would happen happened. Kentucky turned out to be great across the board. We stopped hearing about the moody and inconsistent Harrison brothers, doubtless because UK in addition to all of its other distinctions gave the ball away on just 15 percent of its SEC possessions. Basically all of the things a team brimming with “today’s” elite recruits isn’t supposed to be able to do — taking care of the ball, playing defense, hitting free throws, sharing minutes — Kentucky did.
Projected NCAA bids: Kentucky, Arkansas, LSU, Georgia, Ole Miss.
Ole Miss is showing up on the mocks as a No. 11 seed. The fact that other teams are listed beneath them in the bracket should mean the Rebels are relatively safe, but the committee averages about 1.75 huge surprises per Selection Sunday. The safest course here, as always, is to keep winning. As for Texas A&M, the Aggies appear to be on the outside looking in. Then again any slip-ups by the likes of Indiana, Temple, BYU, et al. would surely help Billy Kennedy’s team.
—
Congratulations, Ponies
American                  W-L   Pace    PPP   Opp. PPP    EM
1.  SMU                  15-3   61.9    1.11    0.95    +0.16
2.  Cincinnati           13-5   59.6    1.05    0.93    +0.12
3.  Tulsa                14-4   62.6    1.01    0.92    +0.09
4.  Temple               13-5   63.9    1.00    0.91    +0.09
5.  Connecticut          10-8   60.9    1.03    0.98    +0.05
6.  Memphis              10-8   64.0    1.02    0.98    +0.04
7.  Tulane               6-12   60.8    0.95    1.03    -0.08
8.  Houston              4-14   62.2    0.96    1.05    -0.09
9.  East Carolina        6-12   59.4    0.98    1.07    -0.09
10. UCF                  5-13   63.1    0.99    1.12    -0.13
11. South Florida        3-15   61.6    0.91    1.07    -0.16

AVG.                            61.8    1.00
SMU’s regular-season title was the program’s first championship since the Mustangs hung a banner as Southwest Conference champs in 1993. That was also the last time that Southern Methodist played in the NCAA tournament.
Projected NCAA bids: SMU, Cincinnati, Temple.
Tulsa may have to jump four or five other bubble aspirants to snare an at-large. And, of course, the conference tournament’s being played in Hartford. That should help Connecticut do better than the Huskies otherwise would, but only a tournament title is going to get UConn into the big dance. Note additionally that an opening-round win over South Florida will pit Kevin Ollie’s team against Tuesday Truths No. 2 Cincinnati.
—
Davidson climbs aboard the #MoreAccuracy bandwagon
A-10                      W-L   Pace    PPP   Opp. PPP    EM
1.  Davidson             14-4   65.5    1.17    1.01    +0.16
2.  Dayton               13-5   63.6    1.07    0.95    +0.12
3.  Richmond             12-6   62.5    1.05    0.95    +0.10
4.  VCU                  12-6   66.5    1.01    0.94    +0.07
5.  Rhode Island         13-5   65.8    0.99    0.93    +0.06
6.  George Washington    10-8   60.6    1.05    1.03    +0.02
7.  St. Bonaventure      10-8   63.3    1.01    1.01     0.00
8.  La Salle             8-10   64.0    0.93    0.94    -0.01
9.  UMass                10-8   66.1    0.99    1.02    -0.03
10. Saint Joseph's       7-11   64.5    0.97    1.00    -0.03
11. Fordham              4-14   67.0    0.97    1.06    -0.09
12. Duquesne             6-12   67.0    1.05    1.15    -0.10
13. George Mason         4-14   63.3    0.98    1.08    -0.10
14. Saint Louis          3-15   63.5    0.92    1.08    -0.16

AVG.                            64.5    1.01
Congratulations to the Wildcats, A-10 champions in their first season in the league. Bob McKillop’s team scored 1.56 points per trip in its season-ending 107-78 win at Duquesne, and truth be known these guys have been playing consistently outstanding offense for the last month. Over the course of this current nine-game winning streak, Tyler Kalinoski and company have rung up 1.22 points per possession, thanks to McKillop’s downright Beilein-esque machinations.
As with the Stauskas-era Wolverines and the Gansey-era Mountaineers, the fact that Davidson shoots a a fair number of threes drives an opportunistically and insanely high two-point percentage (57 percent during the win streak) as well as a microscopically low turnover rate (12.5 percent over the same span). The NCAA tournament field should be just a little more high-scoring thanks to the Wildcats’ month-long journey from bracket afterthought to projected No. 10 seed.
Projected NCAA bids: VCU, Dayton, Davidson.
—
Wichita State would be a very good No. 5 seed
Missouri Valley           W-L   Pace    PPP   Opp. PPP    EM
1.  Wichita State        17-1   60.0    1.13    0.88    +0.25
2.  Northern Iowa        16-2   56.3    1.11    0.93    +0.18
3.  Illinois State       11-7   62.1    1.05    0.96    +0.09
4.  Indiana State        11-7   63.9    1.03    1.00    +0.03
5.  Evansville            9-9   63.1    0.98    1.00    -0.02
6.  Loyola               8-10   57.7    1.00    1.05    -0.05
7.  Southern Illinois    4-14   60.7    0.94    1.05    -0.11
8.  Bradley              3-15   60.5    0.91    1.02    -0.11
9.  Drake                6-12   56.8    1.01    1.13    -0.12
10. Missouri State       5-13   59.1    0.91    1.05    -0.14

AVG.                            60.0    1.01
These numbers are repeated from last week when they were already final, and as you can see that win by Illinois State over Wichita State in the Arch Madness semifinals was indeed an upset. Northern Iowa beat the Redbirds in the MVC tournament final.
Note that in the mocks the Arch Madness results alone were enough to lift the Panthers to the 4-line, while the Shockers are currently projected as a No. 5 seed. Go fight Recency Effect City Hall all you want, such reshuffling is human nature in mid-March. Nevertheless, the standings this time can be trusted: Gregg Marshall’s team performed at a higher level than UNI and the rest of the Valley over the course of 1,078 round-robin possessions.
Projected NCAA bids: Northern Iowa, Wichita State.
—
Boise State’s good even though it did beat San Jose State by 50 (cont.)
Mountain West             W-L   Pace    PPP   Opp. PPP    EM
1.  Boise State          14-4   62.0    1.11    0.93    +0.18
2.  San Diego State      14-4   59.9    1.03    0.88    +0.15
3.  Colorado State       13-5   66.1    1.10    0.97    +0.13
4.  Utah State           11-7   61.9    1.06    1.00    +0.06
5.  UNLV                 8-10   63.7    1.07    1.03    +0.04
6.  Wyoming              11-7   59.0    0.99    0.98    +0.01
7.  New Mexico           7-11   60.0    0.99    1.00    -0.01
8.  Fresno State         10-8   63.8    1.00    1.02    -0.02
9.  Air Force            6-12   60.9    1.02    1.10    -0.08
10. Nevada               5-13   63.4    0.94    1.07    -0.13
11. San Jose State       0-18   63.4    0.81    1.12    -0.31

AVG.                            62.2    1.01
To recap: San Jose State was outscored by its conference by a larger margin than any team in Tuesday Truths history. (Congratulations, 2008 Oregon State. You’ve at last lost that honor.) Add in the fact that the Mountain West no longer plays a round-robin and you have the potential for some skewed numbers, as seen in Boise State’s 50-point win over the Spartans in January.
Mindful of that fact I starting posting results for all games that did not involve SJSU. Here are the final Tuesday Truths standings in all games between the “other” 10 MWC teams:
The “San Jose State was never born” standings
Mountain West             W-L   Pace    PPP   Opp. PPP    EM
1.  San Diego State      13-4   59.7    1.02    0.88    +0.14
2.  Boise State          12-4   61.5    1.10    0.97    +0.13
3.  Colorado State       11-5   66.6    1.10    1.00    +0.10
4.  Utah State            9-7   61.7    1.06    1.04    +0.02
5.  UNLV                 6-10   63.7    1.06    1.06     0.00
6.  Wyoming               9-7   59.0    0.97    0.98    -0.01
7.  New Mexico           6-11   59.8    0.98    1.02    -0.04
8.  Fresno State          8-8   63.7    0.97    1.03    -0.06
9.  Air Force            4-12   60.9    1.00    1.13    -0.13
10. Nevada               3-13   63.0    0.94    1.10    -0.16

AVG.                            62.0    1.02
Even though the Broncos’ advantage over San Diego State in Tuesday Truths did come down to the fact that Leon Rice’s men simply whomped the heck out of hapless San Jose State, it’s also true that BSU beat the Aztecs by 10 points in San Diego 10 days ago. The Broncs and Derrick Marks closed the regular season winning 14 of their last 15.
Projected NCAA bids: San Diego State, Colorado State, Boise State.
—
Game of the year (for one of the teams) tonight in Vegas
West Coast                W-L   Pace    PPP   Opp. PPP    EM
1.  Gonzaga              17-1   63.4    1.19    0.95    +0.24
2.  BYU                  13-5   68.6    1.18    1.03    +0.15
3.  Saint Mary's         13-5   61.0    1.10    1.01    +0.09
4.  Pepperdine           10-8   62.4    0.99    0.98    +0.01
5.  San Diego            8-10   62.1    0.98    0.99    -0.01
6.  Portland             7-11   64.8    1.05    1.09    -0.04
7.  San Francisco        7-11   64.0    1.03    1.09    -0.06
8.  Santa Clara          7-11   60.5    0.99    1.11    -0.12
9.  Pacific              4-14   61.0    1.00    1.14    -0.14
10. Loyola Marymount     4-14   61.2    1.00    1.15    -0.15

AVG.                            62.9    1.05
These numbers are repeated from last week when they were already final.
Projected NCAA bids: Gonzaga, BYU.
That whole bid-thief phenomenon may be overstated, but bid thieves do arise from time to time. And even one such team’s emergence could be fatal to BYU’s tournament chances. It’s that close. Of course Dave Rose’s team can take the guesswork out of this matter entirely with a win tonight against Gonzaga in the WCC tournament title game. Keep those triple-doubles coming, Kyle Collinsworth.
