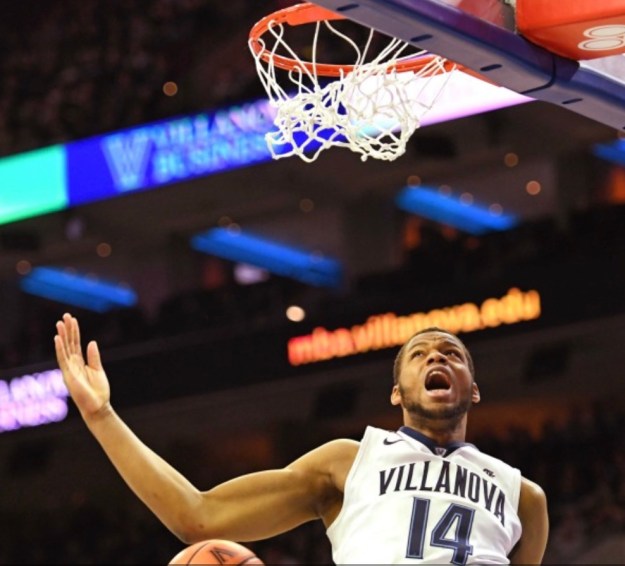
Welcome to the shot-volume party, Wildcats. (NBC Sports)
Last year I cooked up a way of measuring how well teams combine taking care of the ball and getting second chances. I called it a shot volume index, North Carolina led the (major-conference) nation in said measure, and the Tar Heels won a national title. Woo-hoo! Analytic perfection!
Well, not really. UNC is again leading 74 other major-conference teams in terms of shot volume, but, unless the Heels start more closely resembling last year’s team on defense, a repeat is unlikely (though not impossible). No, what I like about measures like this one (there were other trusty metrics for this kind of thing already in place before I came along with mine) is how they show there’s more than one way to generate shots.
More specifically, there are two ways, as seen at the top of this season’s leaderboard.
Shot volume index (SVI)
Through games of February 12
Major-conference games only
    	                 TO%     OR%     SVI
1.  North Carolina      16.1    41.0    102.8
2.  Villanova           12.9    28.4    100.7
3.  Duke                17.2    37.4     99.8
4.  Ole Miss            15.9    32.9     99.8