
Scoring efficiency is up significantly in Division I men’s hoops in 2024 even as shooting accuracy remains more or less the same as it was last year. Teams are simply attempting more shots.
Giving credit for trends on the largest scale is challenging, but one version of events could venture to say the praise for our current high-scoring game might go to Kelvin Sampson and the NCAA, in that order.
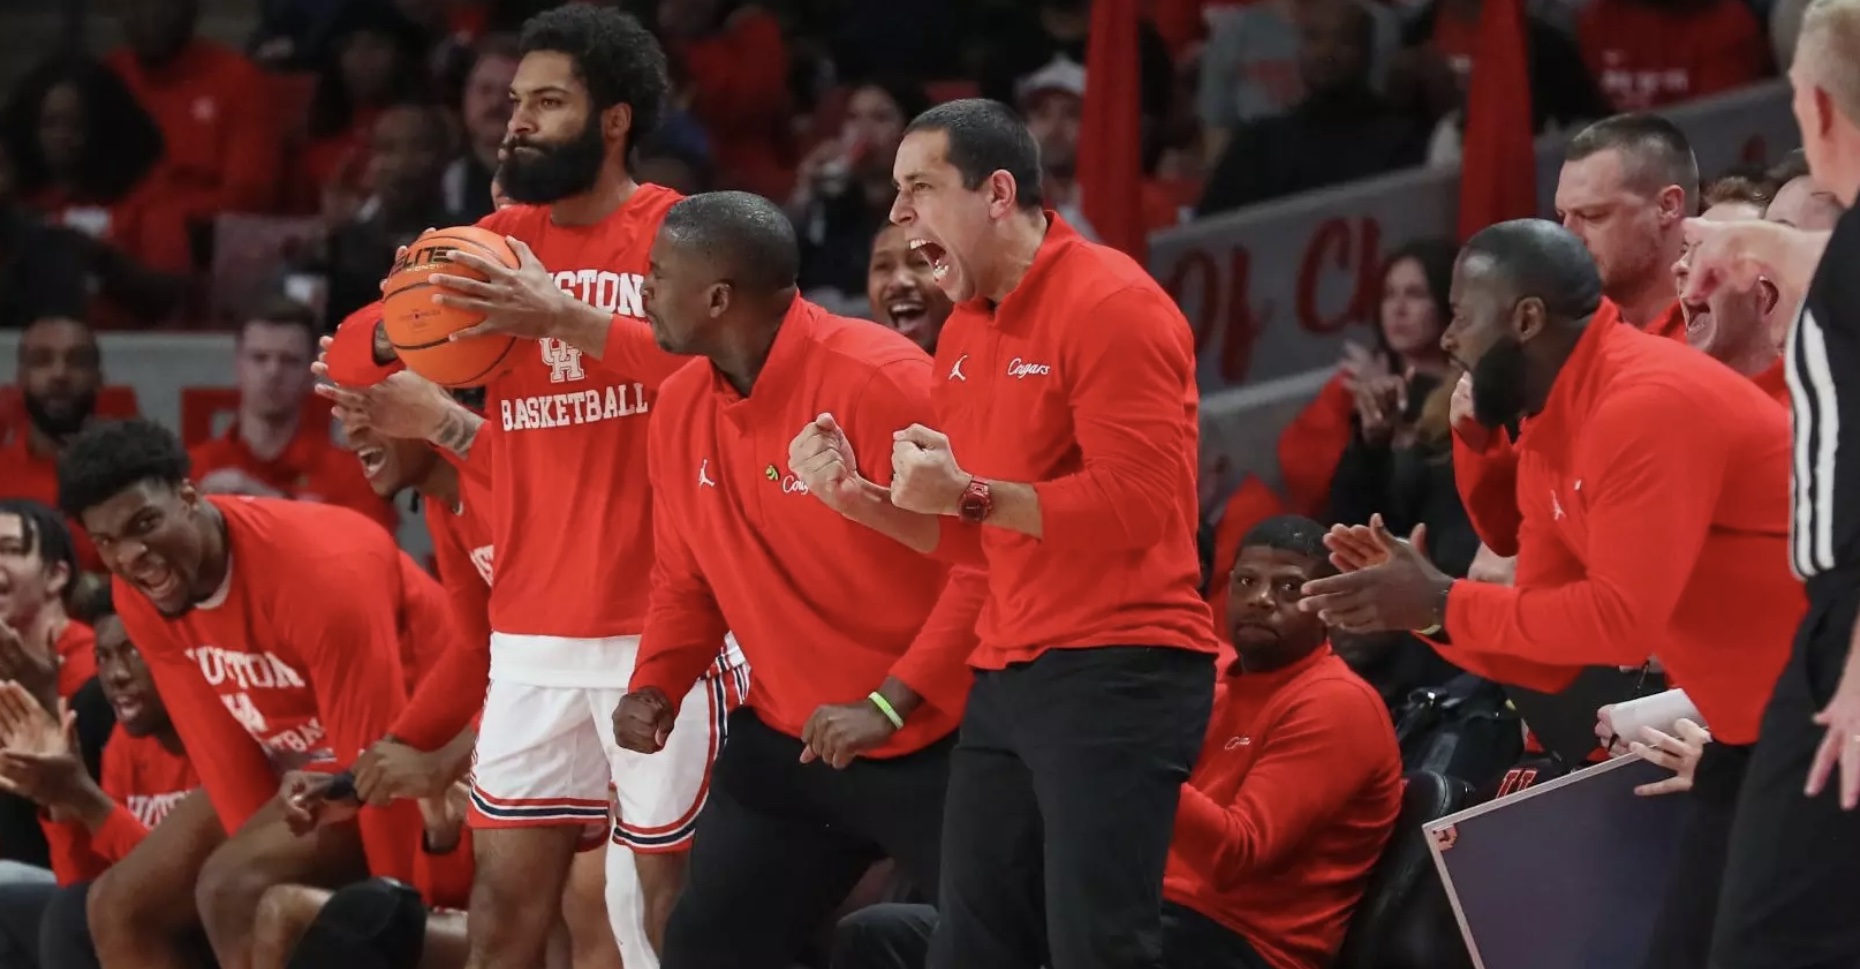
Sampson is the guru of shot volume. This season the guru has landed in what is still, even with the presence of his Houston team, the lowest shot volume league of the six major conferences.
Broadly speaking, the Big 12 hasn’t traditionally done shot volume. More precisely, the league has perhaps hosted two schools of thought represented tidily by recent national champions. The Baylor school does say yes, please, to shot volume. The more influential paradigm, however, has been the Kansas school which has shown vividly you can win national titles, plural, without this volume stuff. This season the Jayhawks are pushing this to an extreme even by their own standards, cruising toward a No. 2 seed while ranking No. 67 out of 80 major-conference teams for shot volume.
Then there’s Sampson. When you watch a Houston game in 2024 the analyst will still say the Cougars’ best play call on offense is a missed shot. This remains a fair description as far as it goes, but tonight, for example, UH will host Cincinnati and based on Big 12 play the Cougars won’t even be the best offensive rebounding team in the building. Houston in 2024 carries the lowest whole-season rank for offensive rebound percentage of any post-pandemic UH team.
Looking only at conference play, the Cougars are in truth one of the weaker offensive rebounding teams among the 2024 shot volume elite.
Shot volume index (SVI)
Conference games only: ACC, Big 12, Big East, Big Ten, Pac-12, SEC
                     TO%     OR%      SVI
1.  Houston          12.3    34.7    104.8
2.  Texas A&M        14.5    39.2    104.3
3.  Florida          14.5    37.9    103.7
4.  Illinois         14.7    36.2    102.6
5.  Purdue           16.4    40.2    102.5
6.  Arizona          14.9    35.6    102.1
7.  Tennessee        14.3    33.3    101.7
8.  UConn            15.9    36.4    101.3
9.  Xavier           15.3    34.8    101.2
10. North Carolina   15.2    33.5    100.7
If you want to single out incredible offensive rebounding in 2024 you look not to Houston but to West Lafayette. Moreover, Purdue needs those offensive boards from a volume standpoint because the Boilermakers commit a normal number of turnovers.
Conversely if you want to single out incredible Bo Ryan- slash John Beilein-level caretaking of the ball, Sampson is your guy. He’s had a great deal of success by having his team attempt more shots than the opponent, and the rest of D-I’s taking notes.
On each “effective” (turnover-less) possession, the Cougars outscore conference opponents by 0.05 points. In real life the margin is 0.16. Combining “possessions ending in an attempt” with “an occasional second chance” yields one powerful substance on offense.
As a case study in how extreme Houston’s 12 percent turnover rate in Big 12 play truly is, consider Richmond. At this very moment the Spiders are straining every muscle in Atlantic 10 play and posting the very same incredible turnover rate as Houston. Richmond, however, combines this amazing work with the nation’s most emphatic “no, thank you” to offensive boards.
If you’ve ever wondered what would happen if a team literally ranked No. 1 in the country for turnover rate but No. 362 for offensive rebounding, now we know. The answer is that your shot volume is not very good. If the Spiders were on the major-conference list below, they would rank No. 66.
A major-conference turnover rate that’s trending down toward 16.0 percent is behind the sky-high 104-ish numbers at the top of the shot volume index. These low turnover rates, in turn, are to an extent downstream from the NCAA’s change to the block/charge rule prior to this season.
Fewer turnovers now result from defenders hurling themselves bodily into the ballhandler’s path. The change in the rules has improved the game both aesthetically and statistically. Well done, NCAA. (Now, about those timeouts.)
Of course, not every team received the “don’t turn the ball over anymore” memo. At the bottom of the shot volume rankings we find mostly offenses mired in turnovers, albeit ones sitting enviously alongside a few conscientious objectors to offensive boards.
Need more scoring chances
Conference games only: ACC, Big 12, Big East, Big Ten, Pac-12, SEC
                     TO%     OR%      SVI
70. Nebraska         16.7    23.6     94.3
71. Missouri         16.6    22.9     94.1
72. Oklahoma State   17.4    24.7     94.0
73. Oregon State     18.0    26.0     94.0
74. Virginia Tech    16.7    22.3     93.7
75. Louisville       18.5    25.5     93.2
76. Notre Dame       20.0    29.3     93.1
77. West Virginia    19.2    25.8     92.5
78. Stanford         18.6    22.7     91.8
79. DePaul           19.0    21.1     90.6
80. Kansas State     22.0    28.6     90.5
Here’s how every major-conference team rates out for shot volume, complete with pithy group labels at plus and minus one standard deviation. Where’s your team?
Shot volume index (SVI)
Conference games only: ACC, Big 12, Big East, Big Ten, Pac-12, SEC
Gluttonous           TO%     OR%      SVI
1.  Houston          12.3    34.7    104.8
2.  Texas A&M        14.5    39.2    104.3
3.  Florida          14.5    37.9    103.7
4.  Illinois         14.7    36.2    102.6
5.  Purdue           16.4    40.2    102.5
6.  Arizona          14.9    35.6    102.1
7.  Tennessee        14.3    33.3    101.7
8.  UConn            15.9    36.4    101.3
9.  Xavier           15.3    34.8    101.2
10. North Carolina   15.2    33.5    100.7
11. St. John's       15.9    34.7    100.5
12. Auburn           14.9    31.9    100.3

Normal               TO%     OR%      SVI
13. Pitt             14.2    29.8    100.1
14. Northwestern     12.5    25.2     99.9
15. Iowa             14.0    28.2     99.6
16. Duke             15.4    31.3     99.5
17. Ole Miss         15.7    31.9     99.4
18. Ohio State       14.6    29.1     99.3
19. Kentucky         14.8    29.4     99.3
20. Virginia         13.3    25.6     99.2
21. NC State         14.0    27.0     99.0
22. Michigan State   13.6    25.9     99.0
23. Alabama          17.6    35.8     98.9
24. Georgetown       16.5    32.8     98.9
25. Oregon           15.0    28.7     98.7
26. Clemson          14.8    28.1     98.6
27. Washington St.   15.9    30.7     98.6
28. Cal              14.2    26.4     98.5
29. Iowa State       16.7    32.3     98.4
30. South Carolina   17.3    33.5     98.2
31. Miss. State      18.6    36.5     98.1
32. Baylor           17.7    34.1     98.0
33. Wisconsin        15.6    28.8     98.0
34. BYU              16.6    31.2     98.0
35. Marquette        15.0    27.0     97.9
36. Butler           14.9    26.4     97.7
37. Vanderbilt       15.5    27.6     97.6
38. UCLA             16.7    30.5     97.6

80-TEAM AVERAGES     16.2    29.1     97.4

                     TO%     OR%      SVI
39. Utah             15.8    27.6     97.2
40. TCU              18.4    34.0     97.2
41. Texas Tech       15.7    27.2     97.2
42. Villanova        13.9    22.7     97.1
43. Rutgers          17.1    30.2     96.9
44. Seton Hall       19.5    36.3     96.9
45. UCF              17.0    29.8     96.9
46. Washington       14.9    24.3     96.7
47. Penn State       14.9    24.1     96.6
48. Wake Forest      15.7    26.0     96.6
49. Maryland         18.3    32.5     96.6
50. LSU              17.4    30.2     96.6
51. Providence       15.7    25.7     96.5
52. Arizona State    14.1    21.8     96.4
53. Minnesota        17.5    29.7     96.2
54. Georgia          16.8    27.9     96.2
55. Creighton        15.1    23.2     95.9
56. USC              17.3    28.5     95.9
57. Texas            17.6    29.1     95.9
58. Indiana          17.2    27.8     95.7
59. Georgia Tech     16.8    26.7     95.7
60. Florida State    16.7    26.4     95.6
61. Cincinnati       20.6    36.4     95.6
62. Arkansas         15.7    23.8     95.6
63. Oklahoma         16.8    26.4     95.5
64. Miami            16.8    26.1     95.4
65. Syracuse         15.1    21.9     95.3
66. Colorado         18.0    28.7     95.2
67. Kansas           16.4    24.5     95.1
68. Boston College   16.5    24.7     95.1
69. Michigan         18.3    28.9     94.9

Starving             TO%     OR%      SVI
70. Nebraska         16.7    23.6     94.3
71. Missouri         16.6    22.9     94.1
72. Oklahoma State   17.4    24.7     94.0
73. Oregon State     18.0    26.0     94.0
74. Virginia Tech    16.7    22.3     93.7
75. Louisville       18.5    25.5     93.2
76. Notre Dame       20.0    29.3     93.1
77. West Virginia    19.2    25.8     92.5
78. Stanford         18.6    22.7     91.8
79. DePaul           19.0    21.1     90.6
80. Kansas State     22.0    28.6     90.5
Enjoy all the scoring!
