
Wisconsin is ranked No. 11 in the AP poll and the Badgers are currently being projected as an NCAA tournament No. 3 seed by the bracket hive mind. Greg Gard’s team has achieved this lofty status in spite of the fact that this very same group barely cracks the top 30 at KenPom and, indeed, has outscored its Big Ten opponents by an average of just 0.6 points per game over the course of 11 outings.
What can account for this disparity? Start with the usual February suspects, such as Wisconsin’s almost Providence-like wizardry in close games. The Badgers are 12-1 in contests decided by single digits, with the only close loss coming at the hands of the aforementioned clutch Friars.
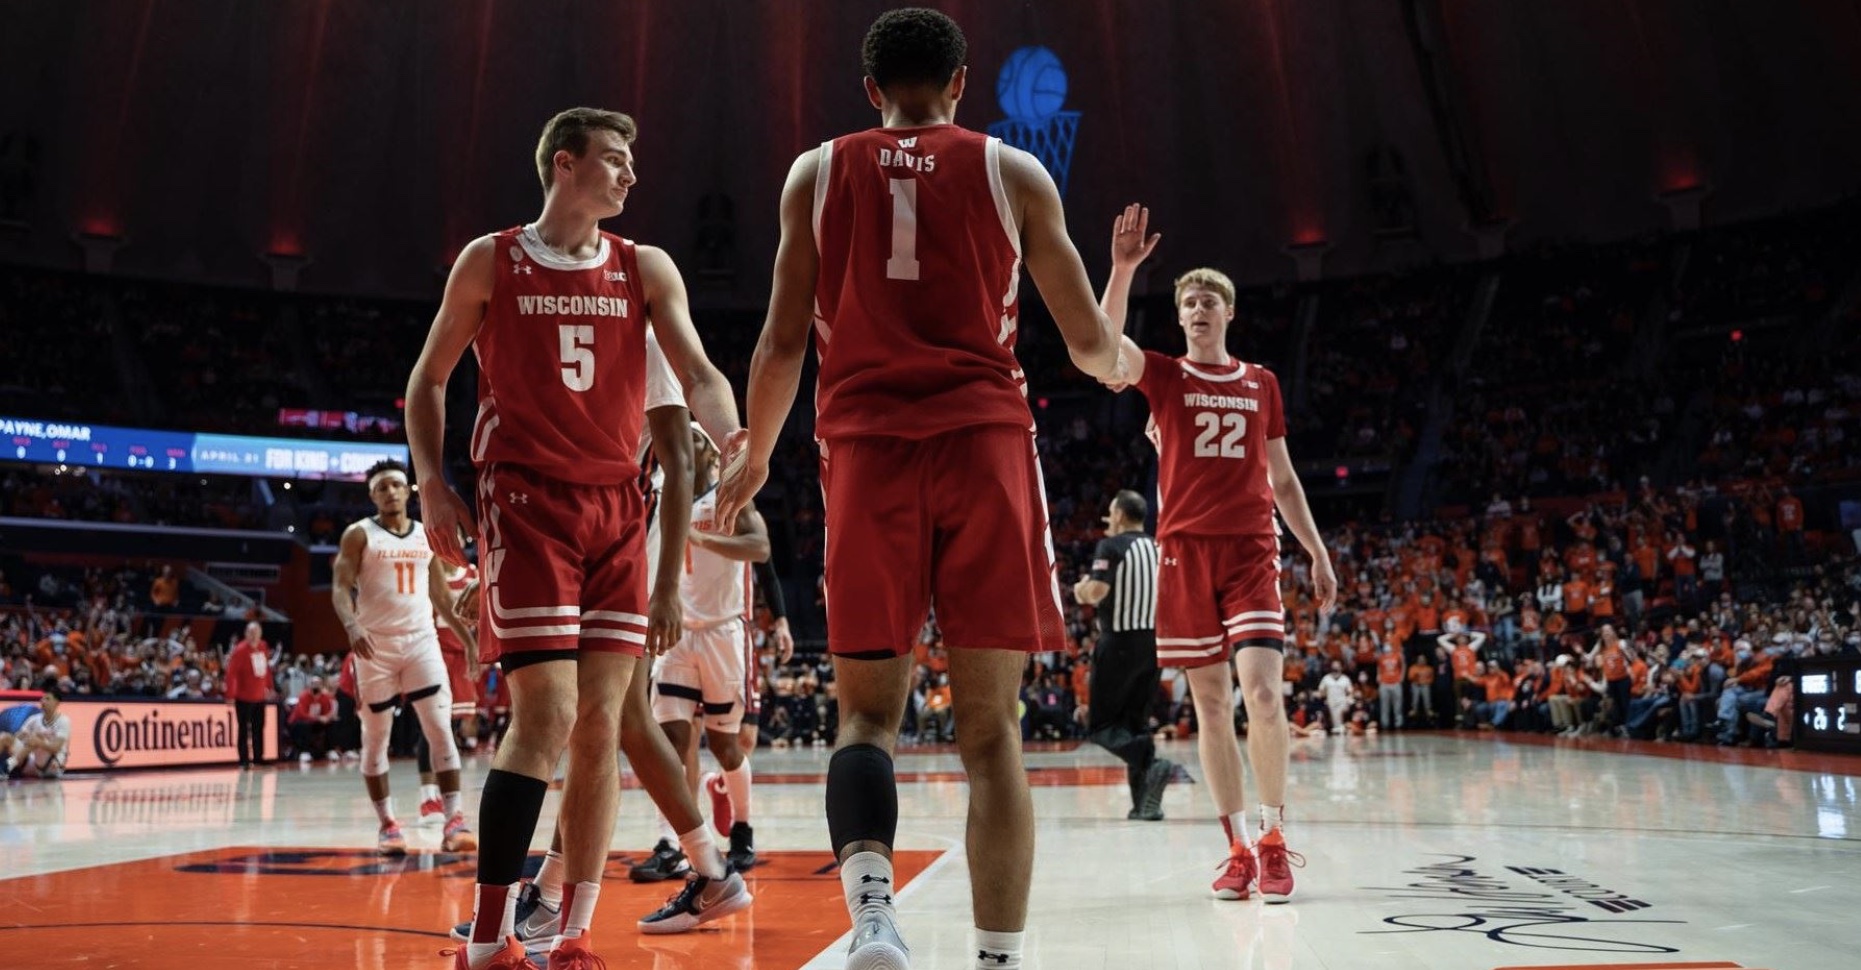
It is also the case, however, that Johnny Davis and his mates are actively and wantonly deceiving our eyes. When you watch a Wisconsin game or when a studio analyst breaks down some UW half-court sequences at the intermission, it’s possible that neither of you will remark upon the fact that Gard’s charges recorded hardly any turnovers. Yet that very fact is a significant ingredient in how the sausage gets made in Madison. The Badgers own the lowest turnover rate of any major-conference team in league play, and that allows them to attempt an exceptionally high number of shots.
Shot volume index (SVI)
Conference games only, through Feb. 3: ACC, Big 12, Big East, Big Ten, Pac-12, SEC
                         TO%     OR%     SVI
1.  Iowa                12.0    27.8    101.7
2.  St. John's          15.8    34.7    100.6
3.  Wisconsin           11.6    24.1    100.4
4.  UConn               17.4    37.7    100.1
5.  Syracuse            16.0    33.9    100.0
Wisconsin’s offensive rebounding is well below the major-conference average, but it’s still in the ballpark of normalcy. Conversely, Minnesota is achieving the same incredible results as the Badgers in the area of near-zero-turnover ball, but the Golden Gophers are getting significantly less bang for their shot-volume buck due to an extreme lack of second chances.
                             TO%     OR%     SVI
18. Minnesota               11.7    20.0     98.2
Ben Johnson is a coach to watch. Posting a turnover rate that’s microscopic even by Big Ten standards in one’s first season at the helm is highly impressive. The Gophers are virtually powerless to stop opposing offenses, particularly in the paint, but by following in the footsteps of Bo Ryan and John Beilein they’re doing the best they can with what they have.
At the other end of the shot volume scale, we find no shortage of teams that will likely make the 2022 NCAA tournament.
                         TO%     OR%     SVI
68. Stanford            23.0    31.9     90.8
69. Iowa State          20.9    25.7     90.5
70. LSU                 23.8    32.9     90.3
71. Creighton           22.8    29.8     90.1
72. TCU                 25.2    34.6     89.3
73. Vanderbilt          20.6    22.0     89.2
74. Oklahoma            23.3    27.9     88.7
75. Georgia             22.1    24.4     88.6
76. Ole Miss            23.1    26.4     88.3
TCU’s turnover rate in particular is remarkable coming from a good team. As it happens Jamie Dixon’s bunch is right at the Big 12 average for two-point accuracy, they just never get the chance to actually shoot. It’s conceivable that no team in the field of 68 will be more dependent on its outstanding defensive rebounding to the exclusion of all else than the Horned Frogs.
At least Dixon has plenty of nearby company in his parched Nefud of scoring opportunities. You will read down the shot-volume rankings for a long time before you hit a single Big 12 team.
                             TO%     OR%     SVI
35. Kansas State            16.6    26.6     95.8
The Big 12’s carrying a league-wide turnover rate of 20.8 percent this season. You can’t swing a cat at the top of KenPom’s defensive rankings without knocking over several of the league’s teams, but there’s a smidge more feast-or-famine in those figures than one might expect. A somewhat less statistically impressive defense like the one at Kansas, to take one example, is actually holding opponents to fewer points per effective (turnover-less) possession in Big 12 play than the rightly analyzed and lauded Texas Tech D, it’s just that teams facing KU rarely commit turnovers.
One more thing. We would be remiss if we did not acknowledge one or two extreme performances to be found outside the six major conferences.
                    TO%     OR%     SVI
Houston            16.8    38.9    101.4
San Francisco      15.8    32.3     99.5
Kelvin Sampson is shot volume Yoda.
San Francisco reportedly goes into each game intending to post a turnover rate under 16 percent and an offensive rebound rate over 33 percent. Well, mission accomplished. That 99.5 bottom line for shot volume is equivalent to what the Dons would get at 16 and 33. Well done, USF.
Here’s how every major-conference team rates out for shot volume, complete with pithy group labels at plus and minus one standard deviation:
Shot volume index (SVI)
Conference games only, through Feb. 2: ACC, Big 12, Big East, Big Ten, Pac-12, SEC
Gluttonous               TO%     OR%     SVI
1.  Iowa                12.0    27.8    101.7
2.  St. John's          15.8    34.7    100.6
3.  Wisconsin           11.6    24.1    100.4
4.  UConn               17.4    37.7    100.1
5.  Syracuse            16.0    33.9    100.0
6.  NC State            14.9    31.0     99.9
7.  Illinois            15.7    32.6     99.7
8.  USC                 16.9    35.6     99.7
9.  North Carolina      15.5    31.2     99.3
10. Xavier              13.6    26.0     99.0
11. Purdue              16.6    33.3     99.0
12. Alabama             18.0    36.5     98.8
13. Villanova           15.4    29.8     98.7
14. UCLA                14.0    26.4     98.7

Normal                   TO%     OR%     SVI
15. Mississippi State   18.1    36.4     98.6
16. Virginia            16.0    30.5     98.4
17. Northwestern        15.0    28.0     98.4
18. Minnesota           11.7    20.0     98.2
19. Michigan            16.3    30.6     98.1
20. Auburn              17.4    33.2     98.0
21. Duke                17.8    33.8     97.8
22. Kentucky            16.6    30.2     97.5
23. Miami               13.1    21.7     97.5
24. Arizona             19.3    36.8     97.4
25. Oregon              17.1    30.4     97.0
26. Boston College      16.6    29.0     97.0
27. Florida State       17.4    30.5     96.7
28. Indiana             15.4    25.5     96.7
29. Seton Hall          19.0    34.3     96.6
30. Ohio State          17.3    29.8     96.5
31. Providence          17.6    30.5     96.5
32. Washington State    19.3    34.8     96.5
33. Oregon State        18.5    31.9     96.1
34. Washington          17.0    27.6     95.9
35. Kansas State        16.6    26.6     95.8
36. Notre Dame          13.9    19.3     95.4
37. Louisville          16.1    24.3     95.3 (average)
38. Clemson             17.2    26.7     95.2
39. Georgetown          19.8    33.3     95.2
40. Maryland            16.9    25.8     95.1
41. Penn State          18.9    30.3     94.9
42. Texas A&M           20.1    33.4     94.9
43. Texas Tech          18.4    28.8     94.8
44. Butler              17.1    25.3     94.7
45. Virginia Tech       18.5    28.7     94.6
46. Kansas              21.8    37.2     94.5
47. Arkansas            19.7    31.4     94.4
48. DePaul              19.9    31.6     94.3
49. Oklahoma State      19.4    29.9     94.1
50. Baylor              21.9    36.1     93.9
51. Cal                 17.2    23.8     93.9
52. Michigan State      20.2    31.1     93.7
53. Marquette           16.9    22.6     93.6
54. Rutgers             19.6    29.2     93.6
55. Pitt                20.4    31.2     93.5
56. Texas               20.3    30.4     93.3
57. Florida             20.9    31.4     93.0
58. Wake Forest         19.4    27.1     92.9
59. Arizona State       17.9    23.1     92.7
60. Georgia Tech        17.5    22.0     92.7
61. West Virginia       20.5    29.4     92.6
62. South Carolina      22.0    32.6     92.3

Starving                 TO%     OR%     SVI
63. Tennessee           22.0    32.1     92.0
64. Missouri            21.2    29.5     91.8
65. Utah                21.1    29.0     91.7
66. Nebraska            17.6    19.9     91.6
67. Colorado            21.1    26.9     90.8
68. Stanford            23.0    31.9     90.8
69. Iowa State          20.9    25.7     90.5
70. LSU                 23.8    32.9     90.3
71. Creighton           22.8    29.8     90.1
72. TCU                 25.2    34.6     89.3
73. Vanderbilt          20.6    22.0     89.2
74. Oklahoma            23.3    27.9     88.7
75. Georgia             22.1    24.4     88.6
76. Ole Miss            23.1    26.4     88.3

AVG                     18.2    29.5     95.3
Let’s revisit this stuff in the past tense during Champ Week and see where we landed. See you then.
