
Welcome to this season’s first installment of Tuesday Truths, where I look at how well 75 teams in six conferences are doing against their league opponents on a per-possession basis.
Editor’s note: Tuesday Truths 2019 refuses to play along with your bourgeois time-slavery plastic fantastic Madison Avenue thing by being updated weekly like its name would, um, logically imply. It will instead will appear here and there, now and then, to this one and that one. Also, with today’s post, Tuesday Truths has now made an appearance for 11 consecutive seasons under two different names and across three different sites. Huzzah, The Streak! Take that, KU!
Duke and Louisville are functionally the same ACC team
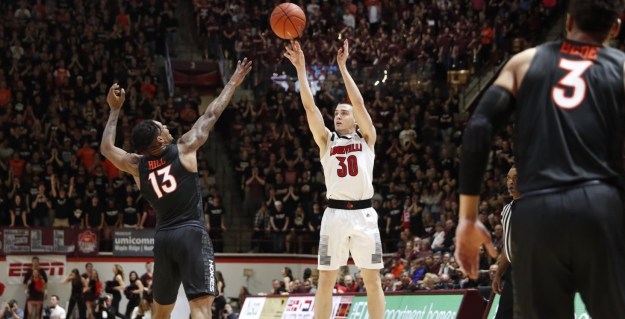
(gocards.com)
Through February 4, conference games only
Pace: possessions per 40 minutes
PPP: points per possession Opp. PPP: opponent PPP
EM: efficiency margin (PPP – Opp. PPP)
ACC                       W-L   Pace    PPP   Opp. PPP    EM
1.  Virginia              8-1   60.8    1.14    0.89    +0.25
2.  Louisville            8-2   69.8    1.12    0.95    +0.17
3.  Duke                  7-1   71.1    1.12    0.96    +0.16
4.  North Carolina        7-1   74.3    1.10    0.97    +0.13
5.  Virginia Tech         7-3   64.1    1.11    1.03    +0.08
6.  Syracuse              7-2   66.9    1.04    0.98    +0.06
7.  Florida State         4-4   67.9    1.02    1.02     0.00
8.  Clemson               3-5   66.3    0.98    0.99    -0.01
9.  NC State              4-5   69.4    1.00    1.04    -0.04
10. Georgia Tech          3-6   68.6    0.88    0.98    -0.10
11. Boston College        2-6   66.8    1.04    1.14    -0.10
12. Pitt                  2-7   69.6    0.96    1.08    -0.12
13. Notre Dame            2-7   65.7    1.01    1.14    -0.13
14. Miami                 1-8   67.0    1.00    1.13    -0.13
15. Wake Forest           1-8   67.5    0.90    1.13    -0.23

AVG.                            67.8     1.03
Duke is a rather well publicized team, and one of Mike Krzyzewski’s players in particular is possibly the best bridge we’ve ever seen between shoe sales and analytic swoons. But we here at Tuesday Truths are all about equal time, so let’s give it up for Louisville.
As seen here, the Cardinals have been more or less identical to the Blue Devils on both sides of the ball in ACC play. Particularly on defense, Louisville and Duke are both working from the same script. Both play very good but no-threat-to-Virginia’s FG defense, and both get a lift from forcing a healthy number of opponent turnovers.
Past this bottom-line point, however, dissimilarities reign supreme.
The Cards actually make threes, with Jordan Nwora, Ryan McMahon, and Dwayne Sutton all shooting 37 percent or better from distance in ACC play. Conversely, if Duke ever does that, it will make Coach K’s team effectively unstoppable. If at some point this season you see multiple Blue Devils consistently hitting shots from beyond the arc, think of it as the college hoops equivalent to the moment in Jurassic Park when the velociraptors learned how to open doors.
—
A tribute to Baylor’s first eight conference games
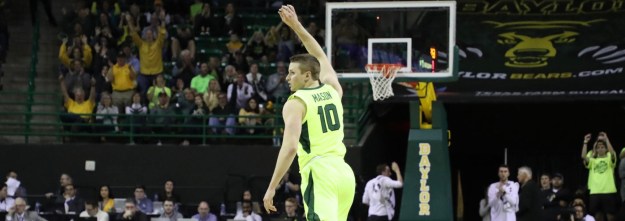
(baylorbears.com)
Big 12                    W-L   Pace    PPP   Opp. PPP    EM
1.  Baylor                6-2   67.1    1.15    1.01    +0.14
2.  Iowa State            7-3   67.4    1.07    0.98    +0.09
3.  Kansas State          6-2   61.7    1.02    0.96    +0.06
4.  Texas Tech            6-4   67.7    0.97    0.93    +0.04
5.  Texas                 4-5   62.8    1.05    1.02    +0.03
6.  Kansas                6-3   69.9    1.03    1.00    +0.03
7.  TCU                   3-5   68.5    1.05    1.10    -0.05
8.  Oklahoma              3-7   67.9    0.98    1.05    -0.07
9.  Oklahoma State        2-6   64.2    1.01    1.11    -0.10
10. West Virginia         2-8   69.6    0.95    1.11    -0.16

AVG.                            67.7    1.03
Pollsters and bracketologists remain resolutely unimpressed with Baylor — something about “losing” not one but two “games” at “home” to Texas Southern and Stephen F. Austin — and we here at Tuesday Truths are not in the business of fighting those particular City Halls. Instead we strike a more celebratory note and say simply, future be damned, just feast your eyes on that offense over its first eight conference games.
Now, will Makai Mason and Devonte Bandoo continue to shoot 46 and 52 percent on their medium- and low-volume threes, respectively, against the Big 12? Who knows, maybe. Even if that answer turns out to be no, however, the Bears have another bit of secret sauce….
Shot volume index (SVI)
Turnover and offensive rebound percentages with shot volume
Conference games only, through February 4
                         TO%     OR%     SVI
1.  Baylor              18.8    39.4     99.2
2.  Oklahoma State      16.9    29.1     96.6
3.  Kansas State        17.8    29.4     95.7
4.  Iowa State          15.6    23.5     95.6
5.  Texas               17.9    29.2     95.6
6.  Oklahoma            17.1    26.3     95.2
7.  TCU                 20.1    32.0     94.3
8.  West Virginia       22.6    35.9     93.0
9.  Kansas              19.6    26.9     92.6
10. Texas Tech          19.7    25.1     91.7

AVG                     18.6    29.7     94.9
Shot volume’s no silver bullet on its own, goodness knows (ask Notre Dame about its 2019), but you do get more bang for your buck when you’re literally the only team in your league that’s even trying. It was a sweet start to conference play for BU.
—
Look at this MU defense
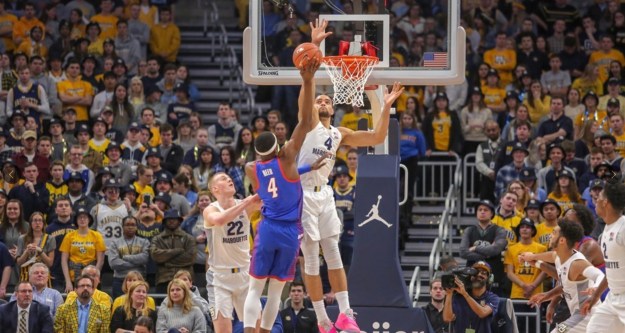
(gomarquette.com)
Big East                  W-L   Pace    PPP   Opp. PPP    EM
1.  Villanova             9-0   66.1    1.20    1.03    +0.17
2.  Marquette             8-1   71.4    1.09    1.01    +0.08
3.  St. John's            4-5   73.4    1.07    1.04    +0.03
4.  Georgetown            4-5   72.3    1.09    1.09     0.00
5.  Butler                4-6   69.0    1.06    1.07    -0.01
6.  Creighton             4-5   69.8    1.11    1.12    -0.01
7.  DePaul                4-6   70.1    1.04    1.09    -0.05
8.  Seton Hall            4-6   71.3    1.00    1.05    -0.05
9.  Providence            3-6   69.0    0.95    1.01    -0.06
10. Xavier                3-7   66.0    1.05    1.14    -0.09

AVG.                            69.8    1.07
One of our motivational posters here in the Tuesday Truths employee kitchen reminds us to always do our level best to aim 2019’s coolest and most tricked-out analytically potent guns in journalistically salient directions. Take Marquette.
The story is, arguably, the defense. It was horrible last year and it’s pretty good now.
Marquette defense
Opponent 2 and effective FG percentages and points per possession
Conference games only
          Opp. 2FG%   Opp. eFG%   Opp. PPP
2018        53.9         55.9       1.13
2019        46.2         49.0       1.01
Improvement on defense is going to get this team, it would appear, a really sweet seed in the tournament. Next year at Big East media day, Steve Wojciechowski will have a spring in his step and a glint in his eye because, for the first time in living memory, his scripted remarks will not be followed by “What about defense?” as the initial question. Congratulations, sir.
—
Illinois, Michigan, Death Valley, and elevation change
Big Ten                   W-L   Pace    PPP   Opp. PPP    EM
1.  Michigan State        9-2   66.5    1.14    0.97    +0.17
2.  Michigan              9-2   65.8    1.03    0.90    +0.13
3.  Wisconsin             8-3   63.7    1.03    0.93    +0.10
4.  Purdue                9-2   64.8    1.14    1.04    +0.10
5.  Maryland              8-4   65.1    1.06    1.01    +0.05
6.  Iowa                  6-5   70.4    1.10    1.09    +0.01
7.  Ohio State            4-6   66.7    1.02    1.03    -0.01
8.  Nebraska              3-8   67.2    1.02    1.05    -0.03
9.  Minnesota             6-5   68.1    1.05    1.09    -0.04
10. Illinois              3-8   70.7    1.00    1.06    -0.06
11. Indiana               4-7   66.0    0.95    1.04    -0.09
12. Penn State           1-10   67.2    0.94    1.04    -0.10
13. Rutgers               4-7   67.0    0.96    1.07    -0.11
14. Northwestern          3-8   66.3    0.90    1.02    -0.12

AVG.                            66.8    1.02
Relative to the yearly conference averages, Illinois is in the midst of perhaps the most foul-prone era the Big Ten has ever* seen.
“Hack factor” returns!
Opponent FTA/FGA, standard deviations above league mean
Conference games only
                        HF
Illinois    2018       2.92
Indiana     2017       2.46
Illinois    2019       2.22
Don’t blame “college basketball today” or the Big Ten, because, in the same league at the same time, Michigan’s setting new standards for total and complete whistle aversion.
Lowest opponent FT rates, 2015-19
Conference games only
                   Opp. FTA/FGA
Wisconsin   2015       0.20
Michigan    2019       0.22
Duke        2018       0.22
Xavier      2018       0.22
These numbers can lead to only one logical conclusion. Cut the Illini some slack, refs.
* “Ever” being etymologically congruent with as far back as I care to go, five years or so.
—
Murry Bartow says life’s a banquet and most poor suckers are starving to death
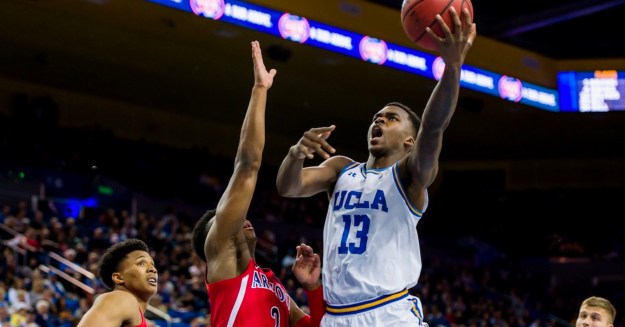
(Scott Chandler, uclabruins.com)
Pac-12                    W-L   Pace    PPP   Opp. PPP    EM
1.  Washington            9-0   67.3    1.10    0.91    +0.19
2.  Arizona State         6-3   71.4    1.10    1.03    +0.07
3.  USC                   6-3   70.0    1.06    1.02    +0.04
4.  UCLA                  5-4   76.2    1.03    0.99    +0.04
5.  Utah                  5-4   68.9    1.10    1.06    +0.04
6.  Oregon State          6-3   68.3    1.11    1.07    +0.04
7.  Oregon                4-5   67.8    1.02    1.02     0.00
8.  Colorado              3-6   68.7    1.01    1.01     0.00
9.  Arizona               5-4   67.9    1.05    1.06    -0.01
10. Stanford              4-5   71.0    1.03    1.05    -0.02
11. Washington State      1-8   68.6    1.02    1.21    -0.19
12. Cal                   0-9   70.7    0.95    1.15    -0.20

AVG.                            69.7    1.05
Since Murry Bartow took over as interim head coach of UCLA, the Bruins have been playing at a really, really fast pace relative to the rest of the Pac-12.
Très vite, one might say….
Velocity factor?
Possessions per 40 minutes, standard deviations above league mean
Conference games only, 2015-19
                         VF
UCLA             2019   2.65
Washington       2016   2.51
Oklahoma         2018   2.45
St. John's       2017   2.26
North Carolina   2019   2.11
Auburn           2018   2.11
You do you, sir.
—
The Vols are very good and very on-theme for 2019
(utsports.com)
SEC                       W-L   Pace    PPP   Opp. PPP    EM
1.  Tennessee             8-0   70.3    1.24    0.99    +0.25
2.  Kentucky              7-1   67.3    1.10    0.91    +0.19
3.  LSU                   7-1   74.4    1.13    1.00    +0.13
4.  Auburn                4-4   72.0    1.15    1.04    +0.11
5.  Alabama               4-4   70.5    1.05    1.05     0.00
6.  Florida               4-4   65.8    1.02    1.02     0.00
7.  Ole Miss              4-4   70.7    1.06    1.06     0.00
8.  Mississippi State     4-4   70.6    1.06    1.06     0.00
9.  South Carolina        6-2   72.1    1.06    1.08    -0.02
10. Arkansas              4-4   73.3    1.00    1.04    -0.04
11. Missouri              2-6   69.1    0.96    1.07    -0.11
12. Texas A&M             1-7   69.0    0.98    1.15    -0.17
13. Georgia               1-7   69.1    0.96    1.14    -0.18
14. Vanderbilt            0-8   66.8    0.94    1.13    -0.19

AVG.                            70.1    1.05
Sit back and savor the moment: Tennessee and Kentucky are going to play each other twice starting later this month and in the span of just two weeks.
This is the best pair of teams the SEC’s had since…UK and Florida in 2017? Wildcats and UF in 2012? Point being, this is going to be a great watch.
By the way, Tuesday Truths is still all about the “the Volunteers are the same as Villanova last year, only orange and in a warmer place” parallels….
Best 2-point teams
Conference games only, 2015-19
                            2FG%
Villanova        2018       62.9
Villanova        2017       60.7
Tennessee        2019       59.5
Creighton        2018       57.8
Duke             2019       57.7
Oregon State     2019       57.1
UCLA             2017       56.9
Creighton        2019       56.8
Look at 2019 repping. Anyway, good luck, Tennessee opponents. These guys are good. I’m looking for Rick Barnes to start sporting a pocket square.
